

438
(or
lIIu51I11tions
o
Mapping Patterns of Human Use and Potential Resource Conflicts on Public Lands
KILOMETERS
o 10 20 30
10
20
30
MILES
(c)
'~ . .
~
(~ST. REGIS
-..
( . . "' .~
~
. .,c
'~'~"O'
.r~ ~r"
'l::- .
- , ......
<
Dasymetric Map
POPULA TION DENSITY
(b)
People Pcr Square Mile
> 1000
5 -9.9
•
300 -999
2 -4.9
. 100-299 D 1-1.9
•
50 -99 D Less than I
•
10 -49
0 one (areas excluded as non-populaled)
Lolo ationa! Forest
Administtnlive Boundary
~ Study Area
Io-km Buffer
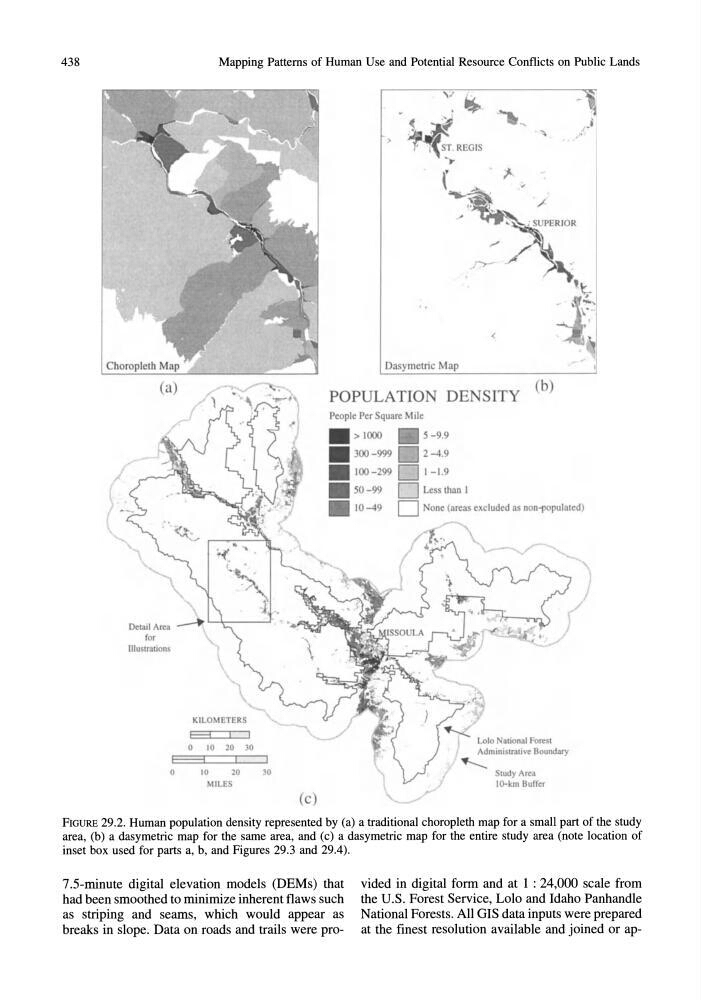
FIGURE 29.2. Human population density represented by (a) a traditional choropleth map for a small part of the study
area, (b) a dasymetric map for the same area, and (c) a dasymetric map for the entire study area (note location of
inset box used for parts a, b, and Figures 29.3 and 29.4).
7.5-minute digital elevation models (DEMs) that
had been smoothed to minimize inherent flaws such
as striping and seams, which would appear as
breaks in slope. Data on roads and trails were provided in digital form and at 1 : 24,000 scale from
the U.S. Forest Service, Lolo and Idaho Panhandle
National Forests. All GIS data inputs were prepared
at the finest resolution available and joined or ap-
(or
lIIu51I11tions
o
Mapping Patterns of Human Use and Potential Resource Conflicts on Public Lands
KILOMETERS
o 10 20 30
10
20
30
MILES
(c)
'~ . .
~
(~ST. REGIS
-..
( . . "' .~
~
. .,c
'~'~"O'
.r~ ~r"
'l::- .
- , ......
<
Dasymetric Map
POPULA TION DENSITY
(b)
People Pcr Square Mile
> 1000
5 -9.9
•
300 -999
2 -4.9
. 100-299 D 1-1.9
•
50 -99 D Less than I
•
10 -49
0 one (areas excluded as non-populaled)
Lolo ationa! Forest
Administtnlive Boundary
~ Study Area
Io-km Buffer
FIGURE 29.2. Human population density represented by (a) a traditional choropleth map for a small part of the study
area, (b) a dasymetric map for the same area, and (c) a dasymetric map for the entire study area (note location of
inset box used for parts a, b, and Figures 29.3 and 29.4).
7.5-minute digital elevation models (DEMs) that
had been smoothed to minimize inherent flaws such
as striping and seams, which would appear as
breaks in slope. Data on roads and trails were provided in digital form and at 1 : 24,000 scale from
the U.S. Forest Service, Lolo and Idaho Panhandle
National Forests. All GIS data inputs were prepared
at the finest resolution available and joined or ap-