

29.3 Methods
A
N
A
D
A
437
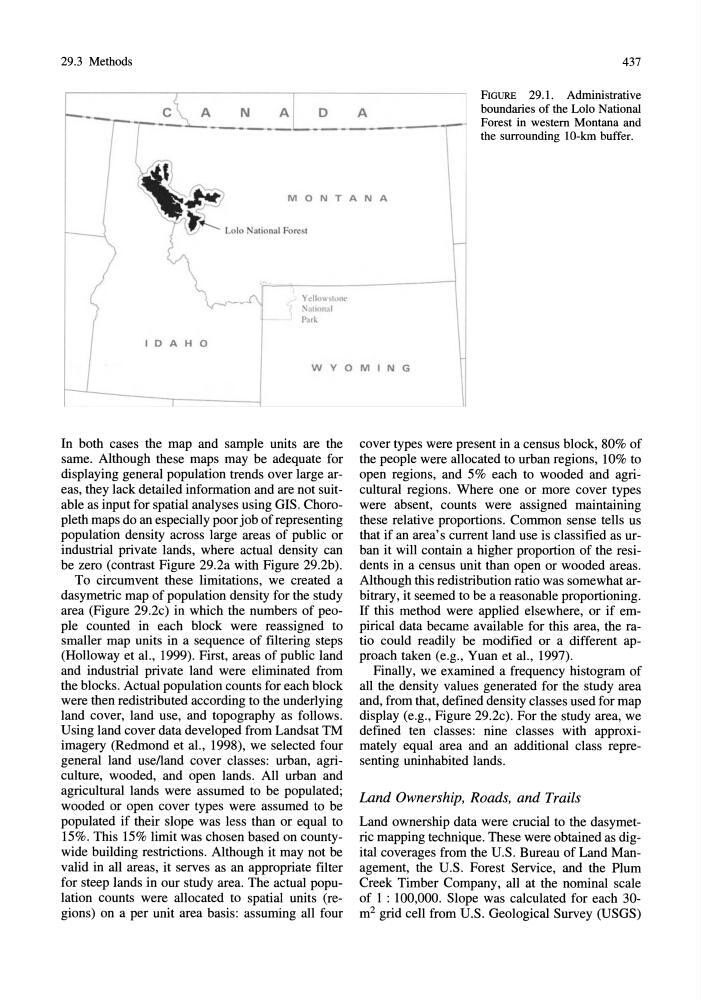
FIGURE 29.1. Administrative
boundaries of the Lolo National
Forest in western Montana and
the surrounding lO-km buffer.
MONTANA
I 0 A H 0
Lolo alional Forest
y r:llow'\vne
~:uiona l
P"l
WYOMING
In both cases the map and sample units are the
same. Although these maps may be adequate for
displaying general population trends over large areas, they lack detailed information and are not suitable as input for spatial analyses using GIS. Choropleth maps do an especially poor job of representing
population density across large areas of public or
industrial private lands, where actual density can
be zero (contrast Figure 29.2a with Figure 29.2b).
To circumvent these limitations, we created a
dasymetric map of population density for the study
area (Figure 29.2c) in which the numbers of people counted in each block were reassigned to
smaller map units in a sequence of filtering steps
(Holloway et aI., 1999). First, areas of public land
and industrial private land were eliminated from
the blocks. Actual population counts for each block
were then redistributed according to the underlying
land cover, land use, and topography as follows.
Using land cover data developed from Landsat TM
imagery (Redmond et aI., 1998), we selected four
general land uselland cover classes: urban, agriculture, wooded, and open lands. All urban and
agricultural lands were assumed to be populated;
wooded or open cover types were assumed to be
populated if their slope was less than or equal to
15%. This 15% limit was chosen based on countywide building restrictions. Although it may not be
valid in all areas, it serves as an appropriate filter
for steep lands in our study area. The actual population counts were allocated to spatial units (regions) on a per unit area basis: assuming all four
cover types were present in a census block, 80% of
the people were allocated to urban regions, 10% to
open regions, and 5% each to wooded and agricultural regions. Where one or more cover types
were absent, counts were assigned maintaining
these relative proportions. Common sense tells us
that if an area's current land use is classified as urban it will contain a higher proportion of the residents in a census unit than open or wooded areas.
Although this redistribution ratio was somewhat arbitrary, it seemed to be a reasonable proportioning.
If this method were applied elsewhere, or if empirical data became available for this area, the ratio could readily be modified or a different approach taken (e.g., Yuan et aI., 1997).
Finally, we examined a frequency histogram of
all the density values generated for the study area
and, from that, defined density classes used for map
display (e.g., Figure 29.2c). For the study area, we
defined ten classes: nine classes with approximately equal area and an additional class representing uninhabited lands.
Land Ownership, Roads, and Trails
Land ownership data were crucial to the dasymetric mapping technique. These were obtained as digital coverages from the U.S. Bureau of Land Management, the U.S. Forest Service, and the Plum
Creek Timber Company, all at the nominal scale
of 1 : 100,000. Slope was calculated for each 30m 2 grid cell from U.S. Geological Survey (USGS)
A
N
A
D
A
437
FIGURE 29.1. Administrative
boundaries of the Lolo National
Forest in western Montana and
the surrounding lO-km buffer.
MONTANA
I 0 A H 0
Lolo alional Forest
y r:llow'\vne
~:uiona l
P"l
WYOMING
In both cases the map and sample units are the
same. Although these maps may be adequate for
displaying general population trends over large areas, they lack detailed information and are not suitable as input for spatial analyses using GIS. Choropleth maps do an especially poor job of representing
population density across large areas of public or
industrial private lands, where actual density can
be zero (contrast Figure 29.2a with Figure 29.2b).
To circumvent these limitations, we created a
dasymetric map of population density for the study
area (Figure 29.2c) in which the numbers of people counted in each block were reassigned to
smaller map units in a sequence of filtering steps
(Holloway et aI., 1999). First, areas of public land
and industrial private land were eliminated from
the blocks. Actual population counts for each block
were then redistributed according to the underlying
land cover, land use, and topography as follows.
Using land cover data developed from Landsat TM
imagery (Redmond et aI., 1998), we selected four
general land uselland cover classes: urban, agriculture, wooded, and open lands. All urban and
agricultural lands were assumed to be populated;
wooded or open cover types were assumed to be
populated if their slope was less than or equal to
15%. This 15% limit was chosen based on countywide building restrictions. Although it may not be
valid in all areas, it serves as an appropriate filter
for steep lands in our study area. The actual population counts were allocated to spatial units (regions) on a per unit area basis: assuming all four
cover types were present in a census block, 80% of
the people were allocated to urban regions, 10% to
open regions, and 5% each to wooded and agricultural regions. Where one or more cover types
were absent, counts were assigned maintaining
these relative proportions. Common sense tells us
that if an area's current land use is classified as urban it will contain a higher proportion of the residents in a census unit than open or wooded areas.
Although this redistribution ratio was somewhat arbitrary, it seemed to be a reasonable proportioning.
If this method were applied elsewhere, or if empirical data became available for this area, the ratio could readily be modified or a different approach taken (e.g., Yuan et aI., 1997).
Finally, we examined a frequency histogram of
all the density values generated for the study area
and, from that, defined density classes used for map
display (e.g., Figure 29.2c). For the study area, we
defined ten classes: nine classes with approximately equal area and an additional class representing uninhabited lands.
Land Ownership, Roads, and Trails
Land ownership data were crucial to the dasymetric mapping technique. These were obtained as digital coverages from the U.S. Bureau of Land Management, the U.S. Forest Service, and the Plum
Creek Timber Company, all at the nominal scale
of 1 : 100,000. Slope was calculated for each 30m 2 grid cell from U.S. Geological Survey (USGS)