

27.2 Tangible Elements
sensed data that has become a standard in the field
for land-use--cover classification. Because the Anderson classification is not strictly a land cover or
land-use classification and was developed to accommodate the method of remote sensing rather
than analytical needs, it has limited usefulness for
both modeling the human system and assessing its
impact on the ecosytem. The NOAA Coastal
Change and Analysis Program (C-CAP) developed
a good land cover classification system (Dobson et
al., 1995) for use with remotely sensed satellite
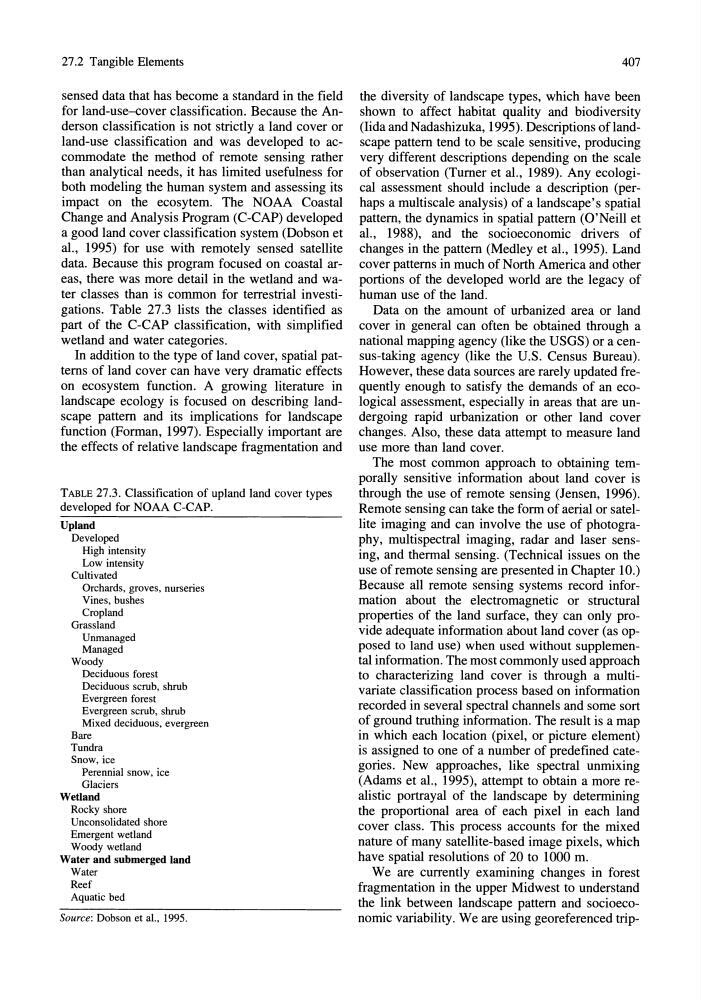
data. Because this program focused on coastal areas, there was more detail in the wetland and water classes than is common for terrestrial investigations. Table 27.3 lists the classes identified as
part of the C-CAP classification, with simplified
wetland and water categories.
In addition to the type of land cover, spatial patterns of land cover can have very dramatic effects
on ecosystem function. A growing literature in
landscape ecology is focused on describing landscape pattern and its implications for landscape
function (Forman, 1997). Especially important are
the effects of relative landscape fragmentation and
TABLE 27.3. Classification of upland land cover types
developed for NOAA C-CAP.
Upland
Developed
High intensity
Low intensity
Cultivated
Orchards, groves, nurseries
Vines, bushes
Cropland
Grassland
Unmanaged
Managed
Woody
Deciduous forest
Deciduous scrub, shrub
Evergreen forest
Evergreen scrub, shrub
Mixed deciduous, evergreen
Bare
Tundra
Snow, ice
Perennial snow, ice
Glaciers
Wetland
Rocky shore
Unconsolidated shore
Emergent wetland
Woody wetland
Water and submerged land
Water
Reef
Aquatic bed
Source: Dobson et aI., 1995.
407
the diversity of landscape types, which have been
shown to affect habitat quality and biodiversity
(Iida and Nadashizuka, 1995). Descriptions oflandscape pattern tend to be scale sensitive, producing
very different descriptions depending on the scale
of observation (Turner et al., 1989). Anyecological assessment should include a description (perhaps a multiscale analysis) of a landscape's spatial
pattern, the dynamics in spatial pattern (O'Neill et
al., 1988), and the socioeconomic drivers of
changes in the pattern (Medley et al., 1995). Land
cover patterns in much of North America and other
portions of the developed world are the legacy of
human use of the land.
Data on the amount of urbanized area or land
cover in general can often be obtained through a
national mapping agency (like the USGS) or a census-taking agency (like the U.S. Census Bureau).
However, these data sources are rarely updated frequently enough to satisfy the demands of an ecological assessment, especially in areas that are undergoing rapid urbanization or other land cover
changes. Also, these data attempt to measure land
use more than land cover.
The most common approach to obtaining temporally sensitive information about land cover is
through the use of remote sensing (Jensen, 1996).
Remote sensing can take the form of aerial or satellite imaging and can involve the use of photography, multispectral imaging, radar and laser sensing, and thermal sensing. (Technical issues on the
use of remote sensing are presented in Chapter 10.)
Because all remote sensing systems record information about the electromagnetic or structural
properties of the land surface, they can only provide adequate information about land cover (as opposed to land use) when used without supplemental information. The most commonly used approach
to characterizing land cover is through a multivariate classification process based on information
recorded in several spectral channels and some sort
of ground truthing information. The result is a map
in which each location (pixel, or picture element)
is assigned to one of a number of predefined categories. New approaches, like spectral unmixing
(Adams et al., 1995), attempt to obtain a more realistic portrayal of the landscape by determining
the proportional area of each pixel in each land
cover class. This process accounts for the mixed
nature of many satellite-based image pixels, which
have spatial resolutions of 20 to 1000 m.
Weare currently examining changes in forest
fragmentation in the upper Midwest to understand
the link between landscape pattern and socioeconomic variability. We are using georeferenced trip-
sensed data that has become a standard in the field
for land-use--cover classification. Because the Anderson classification is not strictly a land cover or
land-use classification and was developed to accommodate the method of remote sensing rather
than analytical needs, it has limited usefulness for
both modeling the human system and assessing its
impact on the ecosytem. The NOAA Coastal
Change and Analysis Program (C-CAP) developed
a good land cover classification system (Dobson et
al., 1995) for use with remotely sensed satellite
data. Because this program focused on coastal areas, there was more detail in the wetland and water classes than is common for terrestrial investigations. Table 27.3 lists the classes identified as
part of the C-CAP classification, with simplified
wetland and water categories.
In addition to the type of land cover, spatial patterns of land cover can have very dramatic effects
on ecosystem function. A growing literature in
landscape ecology is focused on describing landscape pattern and its implications for landscape
function (Forman, 1997). Especially important are
the effects of relative landscape fragmentation and
TABLE 27.3. Classification of upland land cover types
developed for NOAA C-CAP.
Upland
Developed
High intensity
Low intensity
Cultivated
Orchards, groves, nurseries
Vines, bushes
Cropland
Grassland
Unmanaged
Managed
Woody
Deciduous forest
Deciduous scrub, shrub
Evergreen forest
Evergreen scrub, shrub
Mixed deciduous, evergreen
Bare
Tundra
Snow, ice
Perennial snow, ice
Glaciers
Wetland
Rocky shore
Unconsolidated shore
Emergent wetland
Woody wetland
Water and submerged land
Water
Reef
Aquatic bed
Source: Dobson et aI., 1995.
407
the diversity of landscape types, which have been
shown to affect habitat quality and biodiversity
(Iida and Nadashizuka, 1995). Descriptions oflandscape pattern tend to be scale sensitive, producing
very different descriptions depending on the scale
of observation (Turner et al., 1989). Anyecological assessment should include a description (perhaps a multiscale analysis) of a landscape's spatial
pattern, the dynamics in spatial pattern (O'Neill et
al., 1988), and the socioeconomic drivers of
changes in the pattern (Medley et al., 1995). Land
cover patterns in much of North America and other
portions of the developed world are the legacy of
human use of the land.
Data on the amount of urbanized area or land
cover in general can often be obtained through a
national mapping agency (like the USGS) or a census-taking agency (like the U.S. Census Bureau).
However, these data sources are rarely updated frequently enough to satisfy the demands of an ecological assessment, especially in areas that are undergoing rapid urbanization or other land cover
changes. Also, these data attempt to measure land
use more than land cover.
The most common approach to obtaining temporally sensitive information about land cover is
through the use of remote sensing (Jensen, 1996).
Remote sensing can take the form of aerial or satellite imaging and can involve the use of photography, multispectral imaging, radar and laser sensing, and thermal sensing. (Technical issues on the
use of remote sensing are presented in Chapter 10.)
Because all remote sensing systems record information about the electromagnetic or structural
properties of the land surface, they can only provide adequate information about land cover (as opposed to land use) when used without supplemental information. The most commonly used approach
to characterizing land cover is through a multivariate classification process based on information
recorded in several spectral channels and some sort
of ground truthing information. The result is a map
in which each location (pixel, or picture element)
is assigned to one of a number of predefined categories. New approaches, like spectral unmixing
(Adams et al., 1995), attempt to obtain a more realistic portrayal of the landscape by determining
the proportional area of each pixel in each land
cover class. This process accounts for the mixed
nature of many satellite-based image pixels, which
have spatial resolutions of 20 to 1000 m.
Weare currently examining changes in forest
fragmentation in the upper Midwest to understand
the link between landscape pattern and socioeconomic variability. We are using georeferenced trip-