

26.2 Biotic Patterns in Streams
391
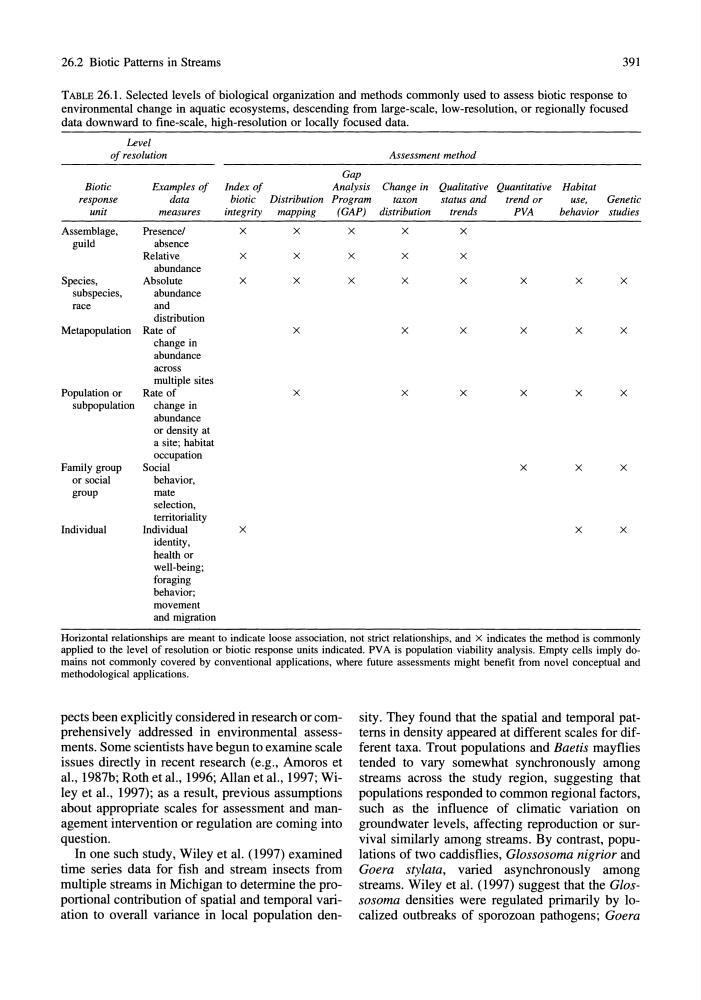
TABLE 26.1. Selected levels of biological organization and methods commonly used to assess biotic response to
environmental change in aquatic ecosystems, descending from large-scale, low-resolution, or regionally focused
data downward to fine-scale, high-resolution or locally focused data.
Level
of resolution
Assessment method
Gap
Biotic
Examples of Index of
Analysis Change in Qualitative Quantitative Habitat
response
data
biotic Distribution Program
taxon
status and
trend or
use,
Genetic
unit
measures
integrity mapping
(GAP) distribution
trends
PYA
behavior studies
Assemblage,
Presence/
X
X
X
X
X
guild
absence
Relative
X
X
X
X
X
abundance
Species,
Absolute
X
X
X
X
X
X
X
X
subspecies,
abundance
race
and
distribution
Metapopulation Rate of
X
X
X
X
X
X
change in
abundance
across
multiple sites
Population or
Rate of
X
X
X
X
X
X
subpopulation
change in
abundance
or density at
a site; habitat
occupation
Family group
Social
X
X
X
or social
behavior,
group
mate
selection,
territoriality
Individual
Individual
X
X
X
identity,
health or
well-being;
foraging
behavior;
movement
and migration
Horizontal relationships are meant to indicate loose association. not strict relationships, and X indicates the method is commonly
applied to the level of resolution or biotic response units indicated. PV A is population viability analysis. Empty cells imply domains not commonly covered by conventional applications, where future assessments might benefit from novel conceptual and
methodological applications.
pects been explicitly considered in research or comprehensively addressed in environmental assessments. Some scientists have begun to examine scale
issues directly in recent research (e.g., Amoros et
al., 1987b; Roth et aI., 1996; Allan et aI., 1997; Wiley et aI., 1997); as a result, previous assumptions
about appropriate scales for assessment and management intervention or regulation are coming into
question.
In one such study, Wiley et ai. (1997) examined
time series data for fish and stream insects from
mUltiple streams in Michigan to determine the proportional contribution of spatial and temporal variation to overall variance in local population density. They found that the spatial and temporal patterns in density appeared at different scales for different taxa. Trout populations and Baetis mayflies
tended to vary somewhat synchronously among
streams across the study region, suggesting that
populations responded to common regional factors,
such as the influence of climatic variation on
groundwater levels, affecting reproduction or survival similarly among streams. By contrast, populations of two caddisflies, Glossosoma nigrior and
Goera stylata, varied asynchronously among
streams. Wiley et al. (1997) suggest that the Glossosoma densities were regulated primarily by localized outbreaks of sporozoan pathogens; Goera
391
TABLE 26.1. Selected levels of biological organization and methods commonly used to assess biotic response to
environmental change in aquatic ecosystems, descending from large-scale, low-resolution, or regionally focused
data downward to fine-scale, high-resolution or locally focused data.
Level
of resolution
Assessment method
Gap
Biotic
Examples of Index of
Analysis Change in Qualitative Quantitative Habitat
response
data
biotic Distribution Program
taxon
status and
trend or
use,
Genetic
unit
measures
integrity mapping
(GAP) distribution
trends
PYA
behavior studies
Assemblage,
Presence/
X
X
X
X
X
guild
absence
Relative
X
X
X
X
X
abundance
Species,
Absolute
X
X
X
X
X
X
X
X
subspecies,
abundance
race
and
distribution
Metapopulation Rate of
X
X
X
X
X
X
change in
abundance
across
multiple sites
Population or
Rate of
X
X
X
X
X
X
subpopulation
change in
abundance
or density at
a site; habitat
occupation
Family group
Social
X
X
X
or social
behavior,
group
mate
selection,
territoriality
Individual
Individual
X
X
X
identity,
health or
well-being;
foraging
behavior;
movement
and migration
Horizontal relationships are meant to indicate loose association. not strict relationships, and X indicates the method is commonly
applied to the level of resolution or biotic response units indicated. PV A is population viability analysis. Empty cells imply domains not commonly covered by conventional applications, where future assessments might benefit from novel conceptual and
methodological applications.
pects been explicitly considered in research or comprehensively addressed in environmental assessments. Some scientists have begun to examine scale
issues directly in recent research (e.g., Amoros et
al., 1987b; Roth et aI., 1996; Allan et aI., 1997; Wiley et aI., 1997); as a result, previous assumptions
about appropriate scales for assessment and management intervention or regulation are coming into
question.
In one such study, Wiley et ai. (1997) examined
time series data for fish and stream insects from
mUltiple streams in Michigan to determine the proportional contribution of spatial and temporal variation to overall variance in local population density. They found that the spatial and temporal patterns in density appeared at different scales for different taxa. Trout populations and Baetis mayflies
tended to vary somewhat synchronously among
streams across the study region, suggesting that
populations responded to common regional factors,
such as the influence of climatic variation on
groundwater levels, affecting reproduction or survival similarly among streams. By contrast, populations of two caddisflies, Glossosoma nigrior and
Goera stylata, varied asynchronously among
streams. Wiley et al. (1997) suggest that the Glossosoma densities were regulated primarily by localized outbreaks of sporozoan pathogens; Goera