

1.4 General Properties of an Ecological Assessment
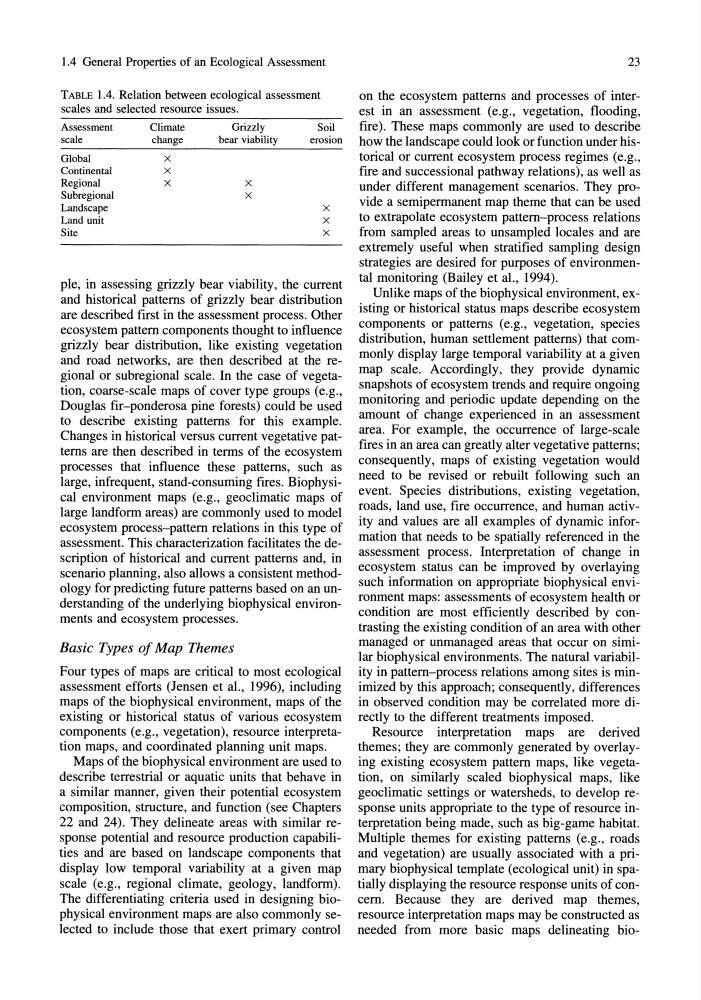
TABLE 1.4. Relation between ecological assessment
scales and selected resource issues.
Assessment
Climate
Grizzly
Soil
scale
change
bear viability
erosion
Global
X
Continental
X
Regional
X
X
Subregional
X
Landscape
X
Land unit
X
Site
X
pIe, in assessing grizzly bear viability, the current
and historical patterns of grizzly bear distribution
are described first in the assessment process. Other
ecosystem pattern components thought to influence
grizzly bear distribution, like existing vegetation
and road networks, are then described at the regional or subregional scale. In the case of vegetation, coarse-scale maps of cover type groups (e.g.,
Douglas fir-ponderosa pine forests) could be used
to describe existing patterns for this example.
Changes in historical versus current vegetative patterns are then described in terms of the ecosystem
processes that influence these patterns, such as
large, infrequent, stand-consuming fires. Biophysical environment maps (e.g., geoclimatic maps of
large landform areas) are commonly used to model
ecosystem process-pattern relations in this type of
assessment. This characterization facilitates the description of historical and current patterns and, in
scenario planning, also allows a consistent methodology for predicting future patterns based on an understanding of the underlying biophysical environments and ecosystem processes.
Basic Types of Map Themes
Four types of maps are critical to most ecological
assessment efforts (Jensen et al., 1996), including
maps of the biophysical environment, maps of the
existing or historical status of various ecosystem
components (e.g., vegetation), resource interpretation maps, and coordinated planning unit maps.
Maps of the biophysical environment are used to
describe terrestrial or aquatic units that behave in
a similar manner, given their potential ecosystem
composition, structure, and function (see Chapters
22 and 24). They delineate areas with similar response potential and resource production capabilities and are based on landscape components that
display low temporal variability at a given map
scale (e.g., regional climate, geology, landform).
The differentiating criteria used in designing biophysical environment maps are also commonly selected to include those that exert primary control
23
on the ecosystem patterns and processes of interest in an assessment (e.g., vegetation, flooding,
fire). These maps commonly are used to describe
how the landscape could look or function under historical or current ecosystem process regimes (e.g.,
fire and successional pathway relations), as well as
under different management scenarios. They provide a semipermanent map theme that can be used
to extrapolate ecosystem pattern-process relations
from sampled areas to unsampled locales and are
extremely useful when stratified sampling design
strategies are desired for purposes of environmental monitoring (Bailey et al., 1994).
Unlike maps of the biophysical environment, existing or historical status maps describe ecosystem
components or patterns (e.g., vegetation, species
distribution, human settlement patterns) that commonly display large temporal variability at a given
map scale. Accordingly, they provide dynamic
snapshots of ecosystem trends and require ongoing
monitoring and periodic update depending on the
amount of change experienced in an assessment
area. For example, the occurrence of large-scale
fires in an area can greatly alter vegetative patterns;
consequently, maps of existing vegetation would
need to be revised or rebuilt following such an
event. Species distributions, existing vegetation,
roads, land use, fire occurrence, and human activity and values are all examples of dynamic information that needs to be spatially referenced in the
assessment process. Interpretation of change in
ecosystem status can be improved by overlaying
such information on appropriate biophysical environment maps: assessments of ecosystem health or
condition are most efficiently described by contrasting the existing condition of an area with other
managed or unmanaged areas that occur on similar biophysical environments. The natural variability in pattern-process relations among sites is minimized by this approach; consequently, differences
in observed condition may be correlated more directly to the different treatments imposed.
Resource interpretation maps are derived
themes; they are commonly generated by overlaying existing ecosystem pattern maps, like vegetation, on similarly scaled biophysical maps, like
geoclimatic settings or watersheds, to develop response units appropriate to the type of resource interpretation being made, such as big-game habitat.
Multiple themes for existing patterns (e.g., roads
and vegetation) are usually associated with a primary biophysical template (ecological unit) in spatially displaying the resource response units of concern. Because they are derived map themes,
resource interpretation maps may be constructed as
needed from more basic maps delineating bio-
TABLE 1.4. Relation between ecological assessment
scales and selected resource issues.
Assessment
Climate
Grizzly
Soil
scale
change
bear viability
erosion
Global
X
Continental
X
Regional
X
X
Subregional
X
Landscape
X
Land unit
X
Site
X
pIe, in assessing grizzly bear viability, the current
and historical patterns of grizzly bear distribution
are described first in the assessment process. Other
ecosystem pattern components thought to influence
grizzly bear distribution, like existing vegetation
and road networks, are then described at the regional or subregional scale. In the case of vegetation, coarse-scale maps of cover type groups (e.g.,
Douglas fir-ponderosa pine forests) could be used
to describe existing patterns for this example.
Changes in historical versus current vegetative patterns are then described in terms of the ecosystem
processes that influence these patterns, such as
large, infrequent, stand-consuming fires. Biophysical environment maps (e.g., geoclimatic maps of
large landform areas) are commonly used to model
ecosystem process-pattern relations in this type of
assessment. This characterization facilitates the description of historical and current patterns and, in
scenario planning, also allows a consistent methodology for predicting future patterns based on an understanding of the underlying biophysical environments and ecosystem processes.
Basic Types of Map Themes
Four types of maps are critical to most ecological
assessment efforts (Jensen et al., 1996), including
maps of the biophysical environment, maps of the
existing or historical status of various ecosystem
components (e.g., vegetation), resource interpretation maps, and coordinated planning unit maps.
Maps of the biophysical environment are used to
describe terrestrial or aquatic units that behave in
a similar manner, given their potential ecosystem
composition, structure, and function (see Chapters
22 and 24). They delineate areas with similar response potential and resource production capabilities and are based on landscape components that
display low temporal variability at a given map
scale (e.g., regional climate, geology, landform).
The differentiating criteria used in designing biophysical environment maps are also commonly selected to include those that exert primary control
23
on the ecosystem patterns and processes of interest in an assessment (e.g., vegetation, flooding,
fire). These maps commonly are used to describe
how the landscape could look or function under historical or current ecosystem process regimes (e.g.,
fire and successional pathway relations), as well as
under different management scenarios. They provide a semipermanent map theme that can be used
to extrapolate ecosystem pattern-process relations
from sampled areas to unsampled locales and are
extremely useful when stratified sampling design
strategies are desired for purposes of environmental monitoring (Bailey et al., 1994).
Unlike maps of the biophysical environment, existing or historical status maps describe ecosystem
components or patterns (e.g., vegetation, species
distribution, human settlement patterns) that commonly display large temporal variability at a given
map scale. Accordingly, they provide dynamic
snapshots of ecosystem trends and require ongoing
monitoring and periodic update depending on the
amount of change experienced in an assessment
area. For example, the occurrence of large-scale
fires in an area can greatly alter vegetative patterns;
consequently, maps of existing vegetation would
need to be revised or rebuilt following such an
event. Species distributions, existing vegetation,
roads, land use, fire occurrence, and human activity and values are all examples of dynamic information that needs to be spatially referenced in the
assessment process. Interpretation of change in
ecosystem status can be improved by overlaying
such information on appropriate biophysical environment maps: assessments of ecosystem health or
condition are most efficiently described by contrasting the existing condition of an area with other
managed or unmanaged areas that occur on similar biophysical environments. The natural variability in pattern-process relations among sites is minimized by this approach; consequently, differences
in observed condition may be correlated more directly to the different treatments imposed.
Resource interpretation maps are derived
themes; they are commonly generated by overlaying existing ecosystem pattern maps, like vegetation, on similarly scaled biophysical maps, like
geoclimatic settings or watersheds, to develop response units appropriate to the type of resource interpretation being made, such as big-game habitat.
Multiple themes for existing patterns (e.g., roads
and vegetation) are usually associated with a primary biophysical template (ecological unit) in spatially displaying the resource response units of concern. Because they are derived map themes,
resource interpretation maps may be constructed as
needed from more basic maps delineating bio-