

21.2 Input-Output Modeling
309
TABLE 21.1. Transactions table for the regional economy.
Endogenous sectors
Exogenous sectors
( 1)
(2)
(3)
(4)
(5)
Exports
and other
Trade and
final
Gross
Agriculture
Industry
services
Households
demand
output
Million dollars
Agriculture
25
30
10
5
30
100
Industry
25
130
170
45
110
480
Trade and
10
90
135
195
70
500
services
Households
30
115
135
10
10
300
Imports and
10
115
50
45
0
220
value added
Gross outlay
100
480
500
300
220
1600
Rows in this table can be represented by the following equation:
n
Xi = Xi! + Xi2 + ... + Xin + Yi = L Xij + Yi,
j
where Xi = total output of sector i,
xii = sector i output that is delivered as input to sector j (sales of producers' goods or intermediate sales)
Yi = sales to final demand for sector i,
n = number of sectors in the transactions table.
In contrast, columns can be represented by
n
Xi = xli + x2i + ... + xni + Vj = L xij + Vj,
i
where Xi = total outlay of sector j,
Vj = charges against final demand or payments to a factor of production in sector j.
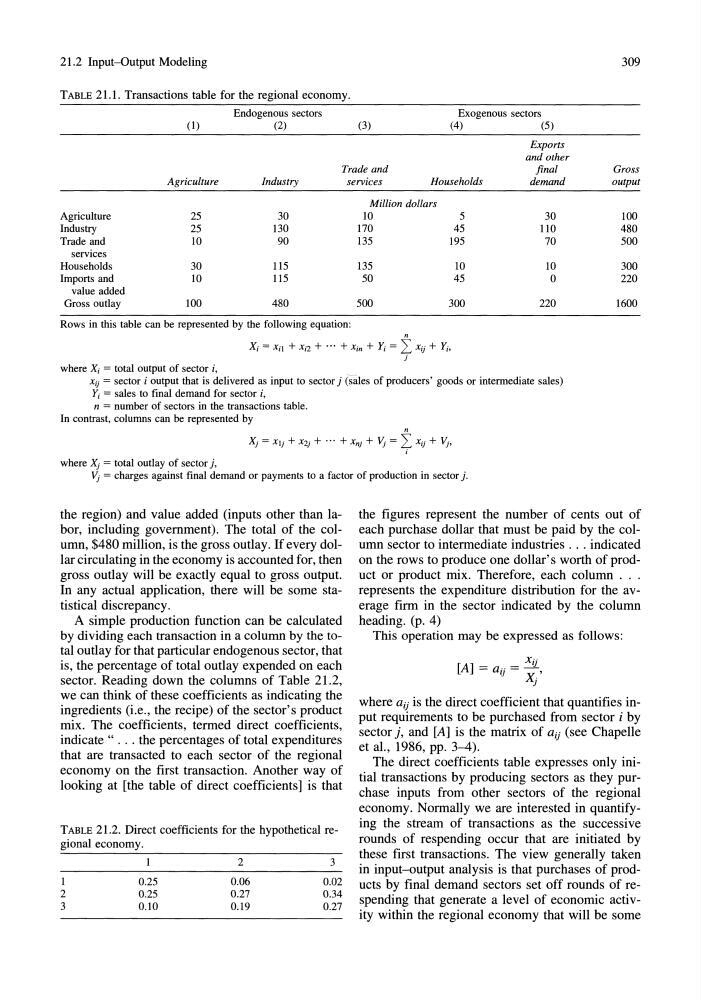
the region) and value added (inputs other than labor, including government). The total of the column, $480 million, is the gross outlay. If every dollar circulating in the economy is accounted for, then
gross outlay will be exactly equal to gross output.
In any actual application, there will be some statistical discrepancy.
A simple production function can be calculated
by dividing each transaction in a column by the total outlay for that particular endogenous sector, that
is, the percentage of total outlay expended on each
sector. Reading down the columns of Table 21.2,
we can think of these coefficients as indicating the
ingredients (i.e., the recipe) of the sector's product
mix. The coefficients, termed direct coefficients,
indicate" ... the percentages of total expenditures
that are transacted to each sector of the regional
economy on the first transaction. Another way of
looking at [the table of direct coefficients] is that
TABLE 21.2. Direct coefficients for the hypothetical regional economy.
1
2
3
0.25
0.25
0.10
2
0.06
0.27
0.19
3
0.02
0.34
0.27
the figures represent the number of cents out of
each purchase dollar that must be paid by the column sector to intermediate industries ... indicated
on the rows to produce one dollar's worth of product or product mix. Therefore, each column . . .
represents the expenditure distribution for the average firm in the sector indicated by the column
heading. (p. 4)
This operation may be expressed as follows:
[A] = a .. = xi)
IJ
X.'
)
where ai) is the direct coefficient that quantifies input requirements to be purchased from sector i by
sector j, and [A] is the matrix of ai) (see Chapelle
et aI., 1986, pp. 3-4).
The direct coefficients table expresses only initial transactions by producing sectors as they purchase inputs from other sectors of the regional
economy. Normally we are interested in quantifying the stream of transactions as the successive
rounds of respending occur that are initiated by
these first transactions. The view generally taken
in input-output analysis is that purchases of products by final demand sectors set off rounds of respending that generate a level of economic activity within the regional economy that will be some
309
TABLE 21.1. Transactions table for the regional economy.
Endogenous sectors
Exogenous sectors
( 1)
(2)
(3)
(4)
(5)
Exports
and other
Trade and
final
Gross
Agriculture
Industry
services
Households
demand
output
Million dollars
Agriculture
25
30
10
5
30
100
Industry
25
130
170
45
110
480
Trade and
10
90
135
195
70
500
services
Households
30
115
135
10
10
300
Imports and
10
115
50
45
0
220
value added
Gross outlay
100
480
500
300
220
1600
Rows in this table can be represented by the following equation:
n
Xi = Xi! + Xi2 + ... + Xin + Yi = L Xij + Yi,
j
where Xi = total output of sector i,
xii = sector i output that is delivered as input to sector j (sales of producers' goods or intermediate sales)
Yi = sales to final demand for sector i,
n = number of sectors in the transactions table.
In contrast, columns can be represented by
n
Xi = xli + x2i + ... + xni + Vj = L xij + Vj,
i
where Xi = total outlay of sector j,
Vj = charges against final demand or payments to a factor of production in sector j.
the region) and value added (inputs other than labor, including government). The total of the column, $480 million, is the gross outlay. If every dollar circulating in the economy is accounted for, then
gross outlay will be exactly equal to gross output.
In any actual application, there will be some statistical discrepancy.
A simple production function can be calculated
by dividing each transaction in a column by the total outlay for that particular endogenous sector, that
is, the percentage of total outlay expended on each
sector. Reading down the columns of Table 21.2,
we can think of these coefficients as indicating the
ingredients (i.e., the recipe) of the sector's product
mix. The coefficients, termed direct coefficients,
indicate" ... the percentages of total expenditures
that are transacted to each sector of the regional
economy on the first transaction. Another way of
looking at [the table of direct coefficients] is that
TABLE 21.2. Direct coefficients for the hypothetical regional economy.
1
2
3
0.25
0.25
0.10
2
0.06
0.27
0.19
3
0.02
0.34
0.27
the figures represent the number of cents out of
each purchase dollar that must be paid by the column sector to intermediate industries ... indicated
on the rows to produce one dollar's worth of product or product mix. Therefore, each column . . .
represents the expenditure distribution for the average firm in the sector indicated by the column
heading. (p. 4)
This operation may be expressed as follows:
[A] = a .. = xi)
IJ
X.'
)
where ai) is the direct coefficient that quantifies input requirements to be purchased from sector i by
sector j, and [A] is the matrix of ai) (see Chapelle
et aI., 1986, pp. 3-4).
The direct coefficients table expresses only initial transactions by producing sectors as they purchase inputs from other sectors of the regional
economy. Normally we are interested in quantifying the stream of transactions as the successive
rounds of respending occur that are initiated by
these first transactions. The view generally taken
in input-output analysis is that purchases of products by final demand sectors set off rounds of respending that generate a level of economic activity within the regional economy that will be some