

17.7 Ecological and Demographic Accounts Integrated with Economic Accounts
251
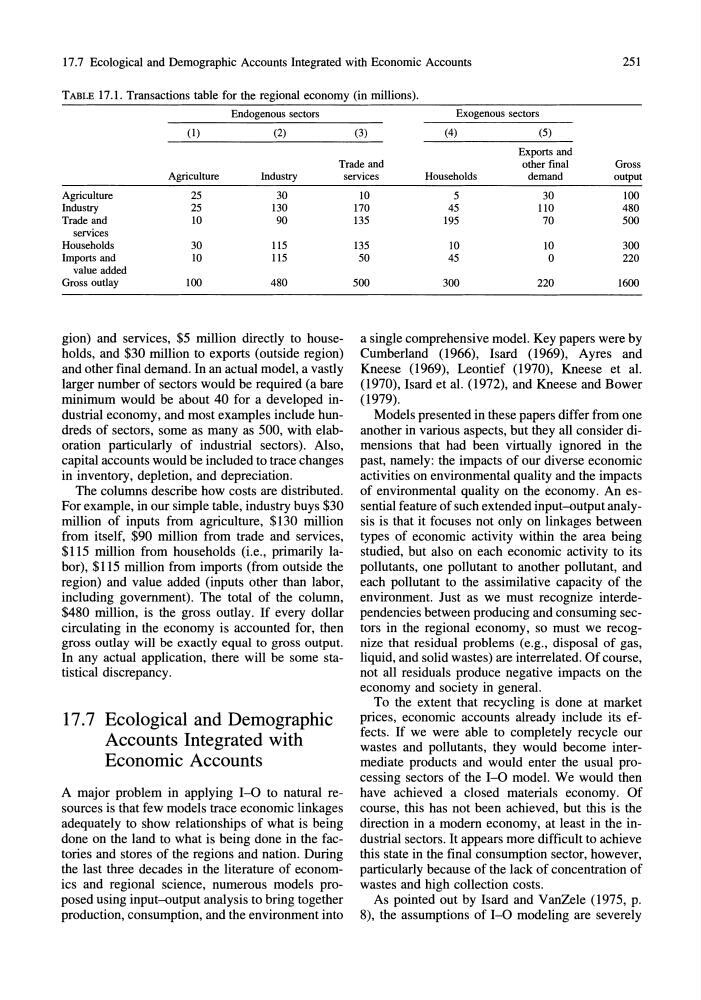
TABLE 17.1. Transactions table for the regional economy (in millions).
Endogenous sectors
Exogenous sectors
(I)
(2)
(3)
(4)
(5)
Exports and
Trade and
other final
Gross
Agriculture
Industry
Agriculture
25
30
Industry
25
130
Trade and
10
90
services
Households
30
115
Imports and
10
115
value added
Gross outlay
100
480
gion) and services, $5 million directly to households, and $30 million to exports (outside region)
and other final demand. In an actual model, a vastly
larger number of sectors would be required (a bare
minimum would be about 40 for a developed industrial economy, and most examples include hundreds of sectors, some as many as 500, with elaboration particularly of industrial sectors). Also,
capital accounts would be included to trace changes
in inventory, depletion, and depreciation.
The columns describe how costs are distributed.
For example, in our simple table, industry buys $30
million of inputs from agriculture, $130 million
from itself, $90 million from trade and services,
$115 million from households (i.e., primarily labor), $115 million from imports (from outside the
region) and value added (inputs other than labor,
including government). The total of the column,
$480 million, is the gross outlay. If every dollar
circulating in the economy is accounted for, then
gross outlay will be exactly equal to gross output.
In any actual application, there will be some statistical discrepancy.
17.7 Ecological and Demographic
Accounts Integrated with
Economic Accounts
A major problem in applying 1-0 to natural resources is that few models trace economic linkages
adequately to show relationships of what is being
done on the land to what is being done in the factories and stores of the regions and nation. During
the last three decades in the literature of economics and regional science, numerous models proposed using input-output analysis to bring together
production, consumption, and the environment into
services
Households
demand
output
10
5
30
100
170
45
110
480
135
195
70
500
135
10
10
300
50
45
0
220
500
300
220
1600
a single comprehensive model. Key papers were by
Cumberland (1966), Isard (1969), Ayres and
Kneese (1969), Leontief (1970), Kneese et al.
(1970), Isard et al. (1972), and Kneese and Bower
(1979).
Models presented in these papers differ from one
another in various aspects, but they all consider dimensions that had been virtually ignored in the
past, namely: the impacts of our diverse economic
activities on environmental quality and the impacts
of environmental quality on the economy. An essential feature of such extended input-output analysis is that it focuses not only on linkages between
types of economic activity within the area being
studied, but also on each economic activity to its
pollutants, one pollutant to another pollutant, and
each pollutant to the assimilative capacity of the
environment. Just as we must recognize interdependencies between producing and consuming sectors in the regional economy, so must we recognize that residual problems (e.g., disposal of gas,
liquid, and solid wastes) are interrelated. Of course,
not all residuals produce negative impacts on the
economy and society in general.
To the extent that recycling is done at market
prices, economic accounts already include its effects. If we were able to completely recycle our
wastes and pollutants, they would become intermediate products and would enter the usual processing sectors of the 1-0 model. We would then
have achieved a closed materials economy. Of
course, this has not been achieved, but this is the
direction in a modem economy, at least in the industrial sectors. It appears more difficult to achieve
this state in the final consumption sector, however,
particularly because of the lack of concentration of
wastes and high collection costs.
As pointed out by Isard and VanZele (1975, p.
8), the assumptions of 1-0 modeling are severely
251
TABLE 17.1. Transactions table for the regional economy (in millions).
Endogenous sectors
Exogenous sectors
(I)
(2)
(3)
(4)
(5)
Exports and
Trade and
other final
Gross
Agriculture
Industry
Agriculture
25
30
Industry
25
130
Trade and
10
90
services
Households
30
115
Imports and
10
115
value added
Gross outlay
100
480
gion) and services, $5 million directly to households, and $30 million to exports (outside region)
and other final demand. In an actual model, a vastly
larger number of sectors would be required (a bare
minimum would be about 40 for a developed industrial economy, and most examples include hundreds of sectors, some as many as 500, with elaboration particularly of industrial sectors). Also,
capital accounts would be included to trace changes
in inventory, depletion, and depreciation.
The columns describe how costs are distributed.
For example, in our simple table, industry buys $30
million of inputs from agriculture, $130 million
from itself, $90 million from trade and services,
$115 million from households (i.e., primarily labor), $115 million from imports (from outside the
region) and value added (inputs other than labor,
including government). The total of the column,
$480 million, is the gross outlay. If every dollar
circulating in the economy is accounted for, then
gross outlay will be exactly equal to gross output.
In any actual application, there will be some statistical discrepancy.
17.7 Ecological and Demographic
Accounts Integrated with
Economic Accounts
A major problem in applying 1-0 to natural resources is that few models trace economic linkages
adequately to show relationships of what is being
done on the land to what is being done in the factories and stores of the regions and nation. During
the last three decades in the literature of economics and regional science, numerous models proposed using input-output analysis to bring together
production, consumption, and the environment into
services
Households
demand
output
10
5
30
100
170
45
110
480
135
195
70
500
135
10
10
300
50
45
0
220
500
300
220
1600
a single comprehensive model. Key papers were by
Cumberland (1966), Isard (1969), Ayres and
Kneese (1969), Leontief (1970), Kneese et al.
(1970), Isard et al. (1972), and Kneese and Bower
(1979).
Models presented in these papers differ from one
another in various aspects, but they all consider dimensions that had been virtually ignored in the
past, namely: the impacts of our diverse economic
activities on environmental quality and the impacts
of environmental quality on the economy. An essential feature of such extended input-output analysis is that it focuses not only on linkages between
types of economic activity within the area being
studied, but also on each economic activity to its
pollutants, one pollutant to another pollutant, and
each pollutant to the assimilative capacity of the
environment. Just as we must recognize interdependencies between producing and consuming sectors in the regional economy, so must we recognize that residual problems (e.g., disposal of gas,
liquid, and solid wastes) are interrelated. Of course,
not all residuals produce negative impacts on the
economy and society in general.
To the extent that recycling is done at market
prices, economic accounts already include its effects. If we were able to completely recycle our
wastes and pollutants, they would become intermediate products and would enter the usual processing sectors of the 1-0 model. We would then
have achieved a closed materials economy. Of
course, this has not been achieved, but this is the
direction in a modem economy, at least in the industrial sectors. It appears more difficult to achieve
this state in the final consumption sector, however,
particularly because of the lack of concentration of
wastes and high collection costs.
As pointed out by Isard and VanZele (1975, p.
8), the assumptions of 1-0 modeling are severely