

16.3 Concept of Economic Value
icy reasons, is not the total value of a particular
quantity of a resource, but rather the change in total value when some action has altered the quantity or quality of the resource in question. This
change in total value can be calculated from the
marginal value curve as the area below the curve,
between the two quantities. Referring to Figure
16.1, if the starting point is quantity A and the
change results in quantity B, the value of the change
is the area below the demand curve between quantities A and B. This measure of the change in total
value would be relevant for a cost-benefit analysis
of a proposed irrigation project that would affect
the flow of water to a region, for example.
Supply
As we saw in the example used in the first part of
this section, the marginal value of water is affected
by the cost of supplying the water. In this example
the cost of supply to the arid region is actually composed of two parts. The first is the cost of transport
and other direct costs of delivery that depend On
the amount of water used. The second is the opportunity cost to the water-rich region of the use
value for each unit of water. Essentially, every unit
they give up in trade is nO longer available for their
own use now or in the future. The foregone benefits are opportunity costs. As water becomes relatively more and more scarce to the people of the
water-rich region, their marginal opportunity costs
increase with each unit given up. The marginal cost
of a unit of water is composed of both types of
costs, direct costs of use and opportunity costs.
Marginal costs per unit of water can be traced
out in a supply curve, analogously to the demand
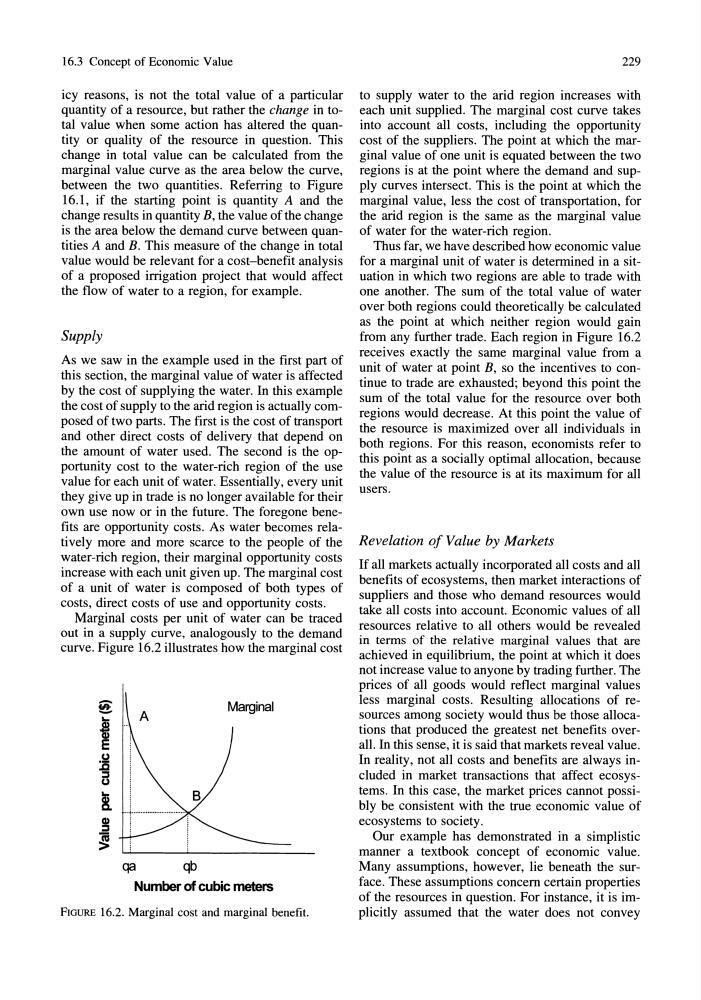
curve. Figure 16.2 illustrates how the marginal cost
Marginal
qa
qb
Number of cubic meters
FIGURE 16.2. Marginal cost and marginal benefit.
229
to supply water to the arid region increases with
each unit supplied. The marginal cost curve takes
into account all costs, including the opportunity
cost of the suppliers. The point at which the marginal value of one unit is equated between the two
regions is at the point where the demand and supply curves intersect. This is the point at which the
marginal value, less the cost of transportation, for
the arid region is the same as the marginal value
of water for the water-rich region.
Thus far, we have described how economic value
for a marginal unit of water is determined in a situation in which two regions are able to trade with
one another. The sum of the total value of water
over both regions could theoretically be calculated
as the point at which neither region would gain
from any further trade. Each region in Figure 16.2
receives exactly the same marginal value from a
unit of water at point B, so the incentives to COntinue to trade are exhausted; beyond this point the
sum of the total value for the resource over both
regions would decrease. At this point the value of
the resource is maximized over all individuals in
both regions. For this reason, economists refer to
this point as a socially optimal allocation, because
the value of the resource is at its maximum for all
users.
Revelation of Value by Markets
If all markets actually incorporated all costs and all
benefits of ecosystems, then market interactions of
suppliers and those who demand resources would
take all costs into account. Economic values of all
resources relative to all others would be revealed
in terms of the relative marginal values that are
achieved in eqUilibrium, the point at which it does
not increase value to anyone by trading further. The
prices of all goods would reflect marginal values
less marginal costs. Resulting allocations of resources among society would thus be those allocations that produced the greatest net benefits overall. In this sense, it is said that markets reveal value.
In reality, not all costs and benefits are always included in market transactions that affect ecosystems. In this case, the market prices cannot possibly be consistent with the true economic value of
ecosystems to society.
Our example has demonstrated in a simplistic
manner a textbook concept of economic value.
Many assumptions, however, lie beneath the surface. These assumptions concern certain properties
of the resources in question. For instance, it is implicitly assumed that the water does not convey
icy reasons, is not the total value of a particular
quantity of a resource, but rather the change in total value when some action has altered the quantity or quality of the resource in question. This
change in total value can be calculated from the
marginal value curve as the area below the curve,
between the two quantities. Referring to Figure
16.1, if the starting point is quantity A and the
change results in quantity B, the value of the change
is the area below the demand curve between quantities A and B. This measure of the change in total
value would be relevant for a cost-benefit analysis
of a proposed irrigation project that would affect
the flow of water to a region, for example.
Supply
As we saw in the example used in the first part of
this section, the marginal value of water is affected
by the cost of supplying the water. In this example
the cost of supply to the arid region is actually composed of two parts. The first is the cost of transport
and other direct costs of delivery that depend On
the amount of water used. The second is the opportunity cost to the water-rich region of the use
value for each unit of water. Essentially, every unit
they give up in trade is nO longer available for their
own use now or in the future. The foregone benefits are opportunity costs. As water becomes relatively more and more scarce to the people of the
water-rich region, their marginal opportunity costs
increase with each unit given up. The marginal cost
of a unit of water is composed of both types of
costs, direct costs of use and opportunity costs.
Marginal costs per unit of water can be traced
out in a supply curve, analogously to the demand
curve. Figure 16.2 illustrates how the marginal cost
Marginal
qa
qb
Number of cubic meters
FIGURE 16.2. Marginal cost and marginal benefit.
229
to supply water to the arid region increases with
each unit supplied. The marginal cost curve takes
into account all costs, including the opportunity
cost of the suppliers. The point at which the marginal value of one unit is equated between the two
regions is at the point where the demand and supply curves intersect. This is the point at which the
marginal value, less the cost of transportation, for
the arid region is the same as the marginal value
of water for the water-rich region.
Thus far, we have described how economic value
for a marginal unit of water is determined in a situation in which two regions are able to trade with
one another. The sum of the total value of water
over both regions could theoretically be calculated
as the point at which neither region would gain
from any further trade. Each region in Figure 16.2
receives exactly the same marginal value from a
unit of water at point B, so the incentives to COntinue to trade are exhausted; beyond this point the
sum of the total value for the resource over both
regions would decrease. At this point the value of
the resource is maximized over all individuals in
both regions. For this reason, economists refer to
this point as a socially optimal allocation, because
the value of the resource is at its maximum for all
users.
Revelation of Value by Markets
If all markets actually incorporated all costs and all
benefits of ecosystems, then market interactions of
suppliers and those who demand resources would
take all costs into account. Economic values of all
resources relative to all others would be revealed
in terms of the relative marginal values that are
achieved in eqUilibrium, the point at which it does
not increase value to anyone by trading further. The
prices of all goods would reflect marginal values
less marginal costs. Resulting allocations of resources among society would thus be those allocations that produced the greatest net benefits overall. In this sense, it is said that markets reveal value.
In reality, not all costs and benefits are always included in market transactions that affect ecosystems. In this case, the market prices cannot possibly be consistent with the true economic value of
ecosystems to society.
Our example has demonstrated in a simplistic
manner a textbook concept of economic value.
Many assumptions, however, lie beneath the surface. These assumptions concern certain properties
of the resources in question. For instance, it is implicitly assumed that the water does not convey