

228
1. Preferences and needs of the people in society
2. Initial patterns of endowment and scarcity of
water
3. Distribution of initial endowments of other items
of value for exchange purposes
4. Costs of transporting water
5. Costs of substitutes such as conservation and purification
6. Information costs of facilitating transactions
7. Possibility of new information that could change
the understanding of society in terms of how the
ecosystem contributes to well-being
The economic value of any ecosystem service is
determined by similar factors. Any method that attempts to determine value in a way that is consistent with the economic value of any other good and
service to society must be defensible as a proxy
that can take into account all these features. This
defensibility of valuation methods has spawned innumerable debates and published papers. Before
turning to methods of valuation, however, the remainder of this section will review a few basic economic concepts that are important to understanding economic value and what valuation methods
attempt to measure.
16.3.1 Concept of Marginal Value
Demand
The previous example described a situation in
which the value of a unit of water changed over the
course of trading between regions. When people of
the arid region had little water, they were willing
to give up a great amount of other resources to gain
access to one more unit of water. As trade progressed between the two regions, the value of one
incremental unit of water changed for the two parties in a predictable manner. The value of one unit
of water increased for the water-rich region as they
gave up more and more water and decreased for
the arid region as they gained access to more and
more water. Trade was predicted to cease when the
formerly arid region had enough water so that the
additional use value of one more unit, less the cost
of transporting it, was exactly equal to the value of
that one unit of water to the people of the formerly
water-rich region.
The notion of scarcity is also relevant within the
framework of a single individual. The more of an
item that an individual already has in her possession for personal use, the less she is likely to value
an additional unit. One additional unit of any good
or service is termed the marginal unit. The concept
Measuring Ecosystem Values
of the marginal unit always implies that there already are a specific number of units prior to the
marginal unit. In terms of economic value, the number of units prior to the marginal unit is a critically
important reference point. The marginal value of a
resource is the value of the marginal unit. Given
that an individual already has access to more water than she needs, the marginal value of 1 cubic
meter of water is low. However, given that an individual has access to no clean water whatsoever,
then his value for one unit, the first unit of water
he would receive, is probably very high.
The notion of a demand curve is simply the
graphical representation of the value of a single unit
of a good or service, given that individuals already
have access to successive quantities of the same
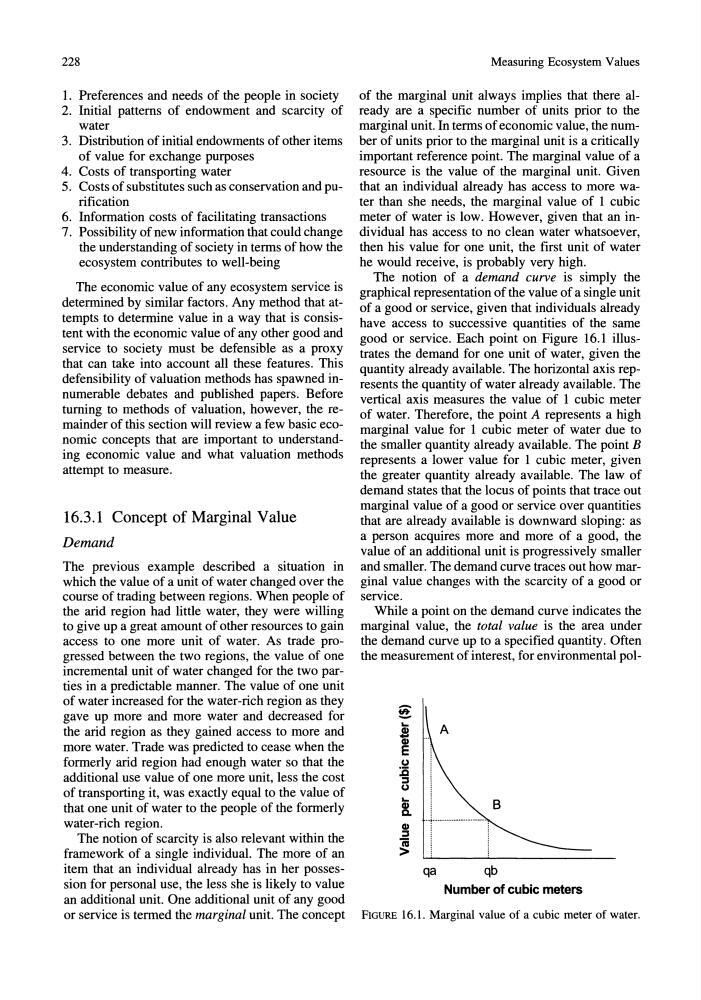
good or service. Each point on Figure 16.1 illustrates the demand for one unit of water, given the
quantity already available. The horizontal axis represents the quantity of water already available. The
vertical axis measures the value of 1 cubic meter
of water. Therefore, the point A represents a high
marginal value for 1 cubic meter of water due to
the smaller quantity already available. The point B
represents a lower value for 1 cubic meter, given
the greater quantity already available. The law of
demand states that the locus of points that trace out
marginal value of a good or service over quantities
that are already available is downward sloping: as
a person acquires more and more of a good, the
value of an additional unit is progressively smaller
and smaller. The demand curve traces out how marginal value changes with the scarcity of a good or
service.
While a point on the demand curve indicates the
marginal value, the total value is the area under
the demand curve up to a specified quantity. Often
the measurement of interest, for environmental pol~
....
~
E
(,)
:c :::l (,)
....
B
Q)
c..
Q)
:::l
iii
>
qa
qb
Number of cubic meters
FIGURE 16.1. Marginal value of a cubic meter of water.
1. Preferences and needs of the people in society
2. Initial patterns of endowment and scarcity of
water
3. Distribution of initial endowments of other items
of value for exchange purposes
4. Costs of transporting water
5. Costs of substitutes such as conservation and purification
6. Information costs of facilitating transactions
7. Possibility of new information that could change
the understanding of society in terms of how the
ecosystem contributes to well-being
The economic value of any ecosystem service is
determined by similar factors. Any method that attempts to determine value in a way that is consistent with the economic value of any other good and
service to society must be defensible as a proxy
that can take into account all these features. This
defensibility of valuation methods has spawned innumerable debates and published papers. Before
turning to methods of valuation, however, the remainder of this section will review a few basic economic concepts that are important to understanding economic value and what valuation methods
attempt to measure.
16.3.1 Concept of Marginal Value
Demand
The previous example described a situation in
which the value of a unit of water changed over the
course of trading between regions. When people of
the arid region had little water, they were willing
to give up a great amount of other resources to gain
access to one more unit of water. As trade progressed between the two regions, the value of one
incremental unit of water changed for the two parties in a predictable manner. The value of one unit
of water increased for the water-rich region as they
gave up more and more water and decreased for
the arid region as they gained access to more and
more water. Trade was predicted to cease when the
formerly arid region had enough water so that the
additional use value of one more unit, less the cost
of transporting it, was exactly equal to the value of
that one unit of water to the people of the formerly
water-rich region.
The notion of scarcity is also relevant within the
framework of a single individual. The more of an
item that an individual already has in her possession for personal use, the less she is likely to value
an additional unit. One additional unit of any good
or service is termed the marginal unit. The concept
Measuring Ecosystem Values
of the marginal unit always implies that there already are a specific number of units prior to the
marginal unit. In terms of economic value, the number of units prior to the marginal unit is a critically
important reference point. The marginal value of a
resource is the value of the marginal unit. Given
that an individual already has access to more water than she needs, the marginal value of 1 cubic
meter of water is low. However, given that an individual has access to no clean water whatsoever,
then his value for one unit, the first unit of water
he would receive, is probably very high.
The notion of a demand curve is simply the
graphical representation of the value of a single unit
of a good or service, given that individuals already
have access to successive quantities of the same
good or service. Each point on Figure 16.1 illustrates the demand for one unit of water, given the
quantity already available. The horizontal axis represents the quantity of water already available. The
vertical axis measures the value of 1 cubic meter
of water. Therefore, the point A represents a high
marginal value for 1 cubic meter of water due to
the smaller quantity already available. The point B
represents a lower value for 1 cubic meter, given
the greater quantity already available. The law of
demand states that the locus of points that trace out
marginal value of a good or service over quantities
that are already available is downward sloping: as
a person acquires more and more of a good, the
value of an additional unit is progressively smaller
and smaller. The demand curve traces out how marginal value changes with the scarcity of a good or
service.
While a point on the demand curve indicates the
marginal value, the total value is the area under
the demand curve up to a specified quantity. Often
the measurement of interest, for environmental pol~
....
~
E
(,)
:c :::l (,)
....
B
Q)
c..
Q)
:::l
iii
>
qa
qb
Number of cubic meters
FIGURE 16.1. Marginal value of a cubic meter of water.