

146
Remote Sensing Applied to Ecosystem Management
Aspen Decline Legend
D spcn and Aspen Mix, 1947- 1992
o Loss of Aspen and Aspen Mix, 1947- 1992
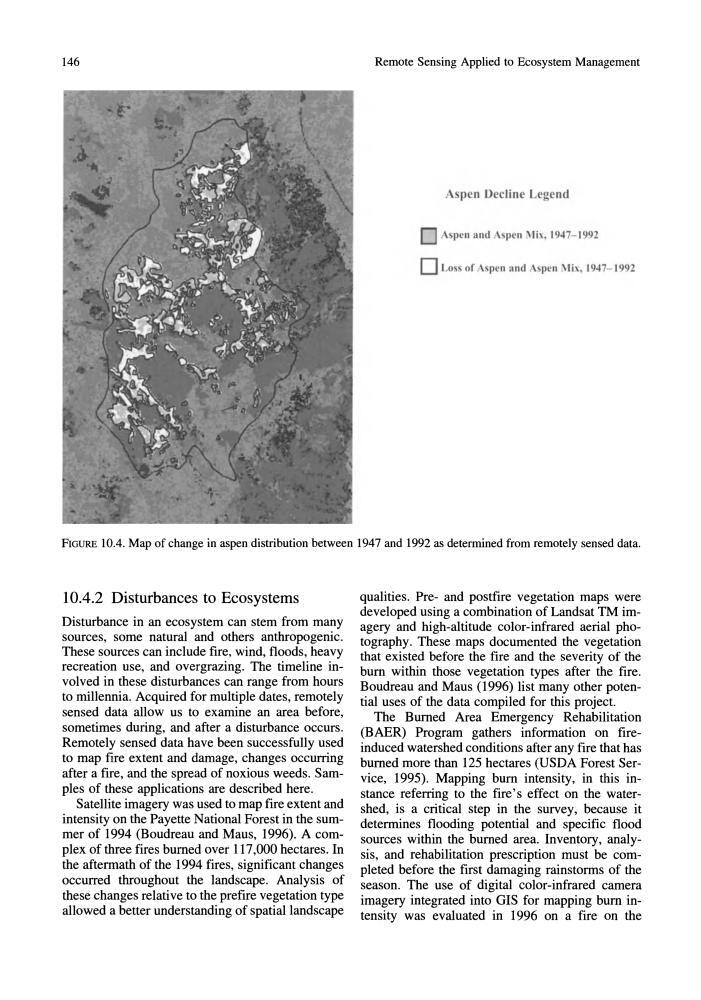
FIGURE 10.4. Map of change in aspen distribution between 1947 and 1992 as determined from remotely sensed data.
10.4.2 Disturbances to Ecosystems
Disturbance in an ecosystem can stem from many
sources, some natural and others anthropogenic.
These sources can include fire, wind, floods, heavy
recreation use, and overgrazing. The timeline involved in these disturbances can range from hours
to millennia. Acquired for multiple dates, remotely
sensed data allow us to examine an area before,
sometimes during, and after a disturbance occurs.
Remotely sensed data have been successfully used
to map fire extent and damage, changes occurring
after a fire, and the spread of noxious weeds. Samples of these applications are described here.
Satellite imagery was used to map fire extent and
intensity on the Payette National Forest in the summer of 1994 (Boudreau and Maus, 1996). A complex of three fires burned over 117,000 hectares. In
the aftermath of the 1994 fires, significant changes
occurred throughout the landscape. Analysis of
these changes relative to the prefrre vegetation type
allowed a better understanding of spatial landscape
qualities. Pre- and postfire vegetation maps were
developed using a combination of Landsat TM imagery and high-altitude color-infrared aerial photography. These maps documented the vegetation
that existed before the fire and the severity of the
bum within those vegetation types after the fire.
Boudreau and Maus (1996) list many other potential uses of the data compiled for this project.
The Burned Area Emergency Rehabilitation
(BAER) Program gathers information on fireinduced watershed conditions after any fire that has
burned more than 125 hectares (USDA Forest Service, 1995). Mapping bum intensity, in this instance referring to the fire's effect on the watershed, is a critical step in the survey, because it
determines flooding potential and specific flood
sources within the burned area. Inventory, analysis, and rehabilitation prescription must be completed before the first damaging rainstorms of the
season. The use of digital color-infrared camera
imagery integrated into GIS for mapping bum intensity was evaluated in 1996 on a fire on the
Remote Sensing Applied to Ecosystem Management
Aspen Decline Legend
D spcn and Aspen Mix, 1947- 1992
o Loss of Aspen and Aspen Mix, 1947- 1992
FIGURE 10.4. Map of change in aspen distribution between 1947 and 1992 as determined from remotely sensed data.
10.4.2 Disturbances to Ecosystems
Disturbance in an ecosystem can stem from many
sources, some natural and others anthropogenic.
These sources can include fire, wind, floods, heavy
recreation use, and overgrazing. The timeline involved in these disturbances can range from hours
to millennia. Acquired for multiple dates, remotely
sensed data allow us to examine an area before,
sometimes during, and after a disturbance occurs.
Remotely sensed data have been successfully used
to map fire extent and damage, changes occurring
after a fire, and the spread of noxious weeds. Samples of these applications are described here.
Satellite imagery was used to map fire extent and
intensity on the Payette National Forest in the summer of 1994 (Boudreau and Maus, 1996). A complex of three fires burned over 117,000 hectares. In
the aftermath of the 1994 fires, significant changes
occurred throughout the landscape. Analysis of
these changes relative to the prefrre vegetation type
allowed a better understanding of spatial landscape
qualities. Pre- and postfire vegetation maps were
developed using a combination of Landsat TM imagery and high-altitude color-infrared aerial photography. These maps documented the vegetation
that existed before the fire and the severity of the
bum within those vegetation types after the fire.
Boudreau and Maus (1996) list many other potential uses of the data compiled for this project.
The Burned Area Emergency Rehabilitation
(BAER) Program gathers information on fireinduced watershed conditions after any fire that has
burned more than 125 hectares (USDA Forest Service, 1995). Mapping bum intensity, in this instance referring to the fire's effect on the watershed, is a critical step in the survey, because it
determines flooding potential and specific flood
sources within the burned area. Inventory, analysis, and rehabilitation prescription must be completed before the first damaging rainstorms of the
season. The use of digital color-infrared camera
imagery integrated into GIS for mapping bum intensity was evaluated in 1996 on a fire on the