

broad theme areas were: terrestrial, water, air, and social/cultural/economic.
Researchers, managers, and analysts comprised the teams.
As shown in Figure 4.1, the geographic scope of the assessment was
defined as a contiguous 37.4-million-acre area, primarily in the mountains
but also in the interspersed ridge-and-valley areas stretching from northern Virginia to northeastern Alabama. Public ownership comprises about
17% of the land area in this region, with more than 90% of the public land
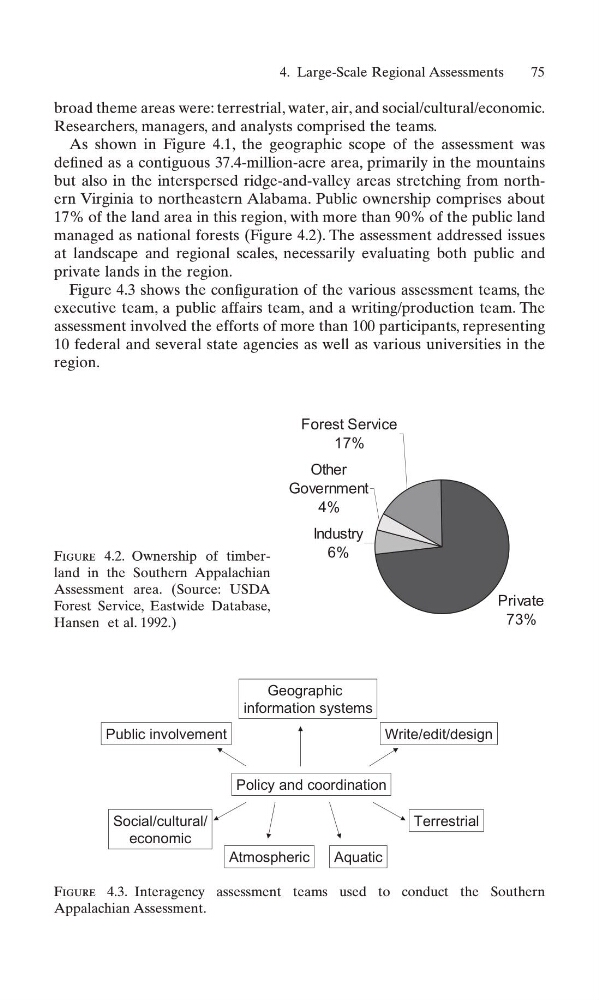
managed as national forests (Figure 4.2). The assessment addressed issues
at landscape and regional scales, necessarily evaluating both public and
private lands in the region.
Figure 4.3 shows the configuration of the various assessment teams, the
executive team, a public affairs team, and a writing/production team. The
assessment involved the efforts of more than 100 participants, representing
10 federal and several state agencies as well as various universities in the
region.
4. Large-Scale Regional Assessments
75
Private
73%
Industry
6%
Other
Government
4%
Forest Service
17%
Figure 4.2. Ownership of timberland in the Southern Appalachian
Assessment area. (Source: USDA
Forest Service, Eastwide Database,
Hansen et al. 1992.)
Policy and coordination
Public involvement
Write/edit/design
Terrestrial
Aquatic
Social/cultural/
economic
Atmospheric
Geographic
information systems
Figure 4.3. Interagency assessment teams used to conduct the Southern
Appalachian Assessment.
Researchers, managers, and analysts comprised the teams.
As shown in Figure 4.1, the geographic scope of the assessment was
defined as a contiguous 37.4-million-acre area, primarily in the mountains
but also in the interspersed ridge-and-valley areas stretching from northern Virginia to northeastern Alabama. Public ownership comprises about
17% of the land area in this region, with more than 90% of the public land
managed as national forests (Figure 4.2). The assessment addressed issues
at landscape and regional scales, necessarily evaluating both public and
private lands in the region.
Figure 4.3 shows the configuration of the various assessment teams, the
executive team, a public affairs team, and a writing/production team. The
assessment involved the efforts of more than 100 participants, representing
10 federal and several state agencies as well as various universities in the
region.
4. Large-Scale Regional Assessments
75
Private
73%
Industry
6%
Other
Government
4%
Forest Service
17%
Figure 4.2. Ownership of timberland in the Southern Appalachian
Assessment area. (Source: USDA
Forest Service, Eastwide Database,
Hansen et al. 1992.)
Policy and coordination
Public involvement
Write/edit/design
Terrestrial
Aquatic
Social/cultural/
economic
Atmospheric
Geographic
information systems
Figure 4.3. Interagency assessment teams used to conduct the Southern
Appalachian Assessment.