

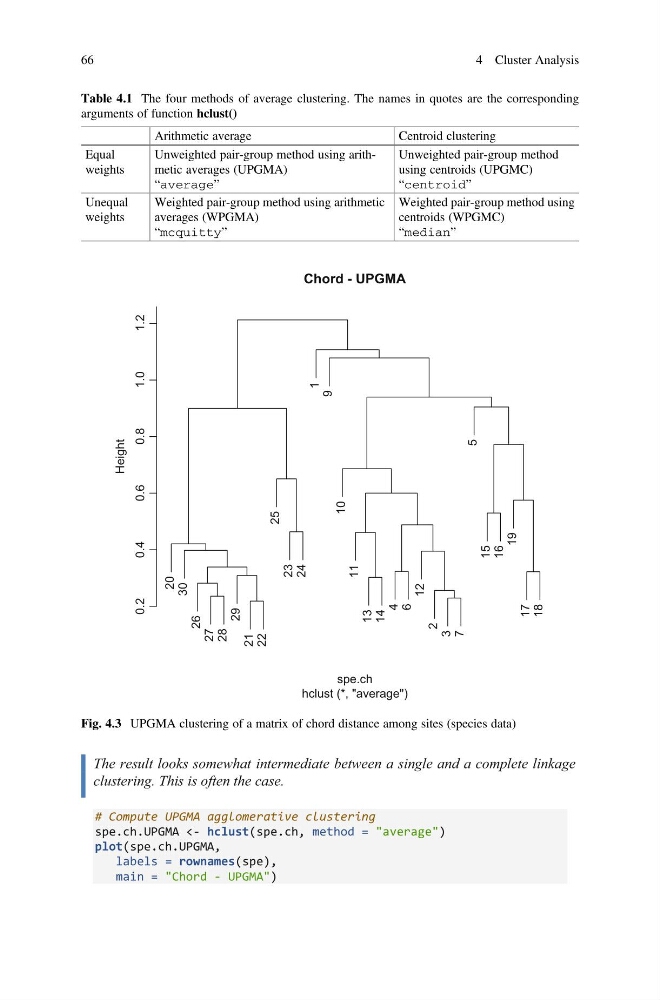
The result looks somewhat intermediate between a single and a complete linkage
clustering. This is often the case.
# Compute UPGMA agglomerative clustering
spe.ch.UPGMA <- hclust(spe.ch, method = "average")
plot(spe.ch.UPGMA,
labels = rownames(spe),
main = "Chord - UPGMA")
Table 4.1 The four methods of average clustering. The names in quotes are the corresponding
arguments of function hclust()
Arithmetic average
Centroid clustering
Equal
weights
Unweighted pair-group method using arithmetic averages (UPGMA)
“average”
Unweighted pair-group method
using centroids (UPGMC)
“centroid”
Unequal
weights
Weighted pair-group method using arithmetic
averages (WPGMA)
“mcquitty”
Weighted pair-group method using
centroids (WPGMC)
“median”
20
30
26
27
28
29
21
22
25
23
24
1
9
10
11
13
14
4
6
12
2
3
7
5
15
16
19
17
18
Chord - UPGMA
spe.ch
hclust (*, "average")
Height
1.2
1.0
0.8
0.6
0.4
0.2
Fig. 4.3 UPGMA clustering of a matrix of chord distance among sites (species data)
66
4 Cluster Analysis
clustering. This is often the case.
# Compute UPGMA agglomerative clustering
spe.ch.UPGMA <- hclust(spe.ch, method = "average")
plot(spe.ch.UPGMA,
labels = rownames(spe),
main = "Chord - UPGMA")
Table 4.1 The four methods of average clustering. The names in quotes are the corresponding
arguments of function hclust()
Arithmetic average
Centroid clustering
Equal
weights
Unweighted pair-group method using arithmetic averages (UPGMA)
“average”
Unweighted pair-group method
using centroids (UPGMC)
“centroid”
Unequal
weights
Weighted pair-group method using arithmetic
averages (WPGMA)
“mcquitty”
Weighted pair-group method using
centroids (WPGMC)
“median”
20
30
26
27
28
29
21
22
25
23
24
1
9
10
11
13
14
4
6
12
2
3
7
5
15
16
19
17
18
Chord - UPGMA
spe.ch
hclust (*, "average")
Height
1.2
1.0
0.8
0.6
0.4
0.2
Fig. 4.3 UPGMA clustering of a matrix of chord distance among sites (species data)
66
4 Cluster Analysis