

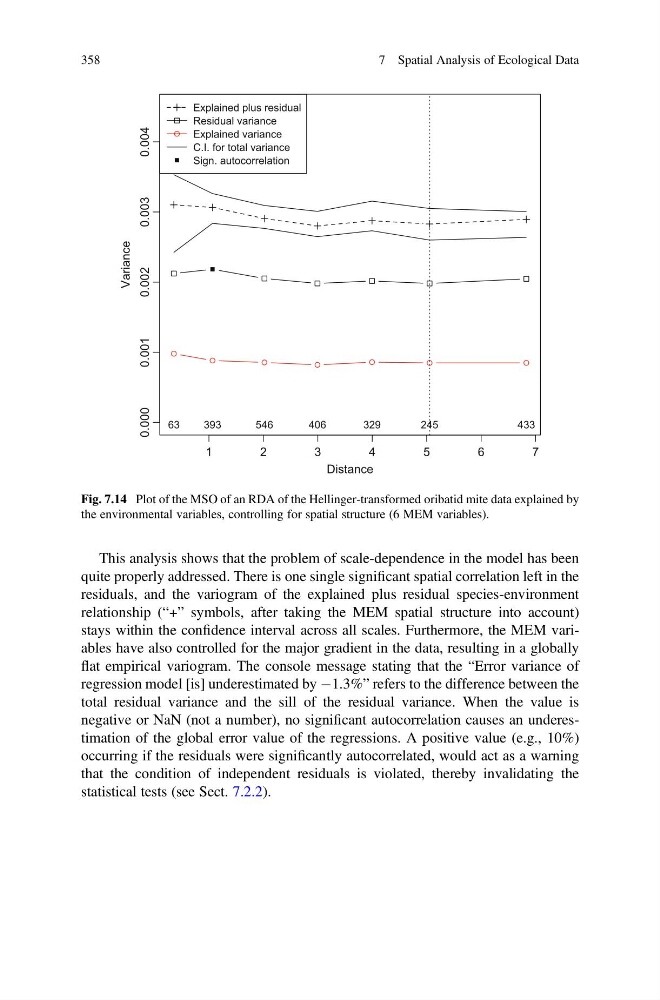
This analysis shows that the problem of scale-dependence in the model has been
quite properly addressed. There is one single significant spatial correlation left in the
residuals, and the variogram of the explained plus residual species-environment
relationship (“+” symbols, after taking the MEM spatial structure into account)
stays within the confidence interval across all scales. Furthermore, the MEM variables have also controlled for the major gradient in the data, resulting in a globally
flat empirical variogram. The console message stating that the “Error variance of
regression model [is] underestimated by À1.3%” refers to the difference between the
total residual variance and the sill of the residual variance. When the value is
negative or NaN (not a number), no significant autocorrelation causes an underestimation of the global error value of the regressions. A positive value (e.g., 10%)
occurring if the residuals were significantly autocorrelated, would act as a warning
that the condition of independent residuals is violated, thereby invalidating the
statistical tests (see Sect. 7.2.2).
1
2
3
4
5
6
7
0.000
0.001
0.002
0.003
0.004
Distance
Variance
Explained plus residual
Residual variance
Explained variance
C.I. for total variance
Sign. autocorrelation
63
393
546
406
329
245
433
Fig. 7.14 Plot of the MSO of an RDA of the Hellinger-transformed oribatid mite data explained by
the environmental variables, controlling for spatial structure (6 MEM variables).
358
7 Spatial Analysis of Ecological Data
quite properly addressed. There is one single significant spatial correlation left in the
residuals, and the variogram of the explained plus residual species-environment
relationship (“+” symbols, after taking the MEM spatial structure into account)
stays within the confidence interval across all scales. Furthermore, the MEM variables have also controlled for the major gradient in the data, resulting in a globally
flat empirical variogram. The console message stating that the “Error variance of
regression model [is] underestimated by À1.3%” refers to the difference between the
total residual variance and the sill of the residual variance. When the value is
negative or NaN (not a number), no significant autocorrelation causes an underestimation of the global error value of the regressions. A positive value (e.g., 10%)
occurring if the residuals were significantly autocorrelated, would act as a warning
that the condition of independent residuals is violated, thereby invalidating the
statistical tests (see Sect. 7.2.2).
1
2
3
4
5
6
7
0.000
0.001
0.002
0.003
0.004
Distance
Variance
Explained plus residual
Residual variance
Explained variance
C.I. for total variance
Sign. autocorrelation
63
393
546
406
329
245
433
Fig. 7.14 Plot of the MSO of an RDA of the Hellinger-transformed oribatid mite data explained by
the environmental variables, controlling for spatial structure (6 MEM variables).
358
7 Spatial Analysis of Ecological Data