

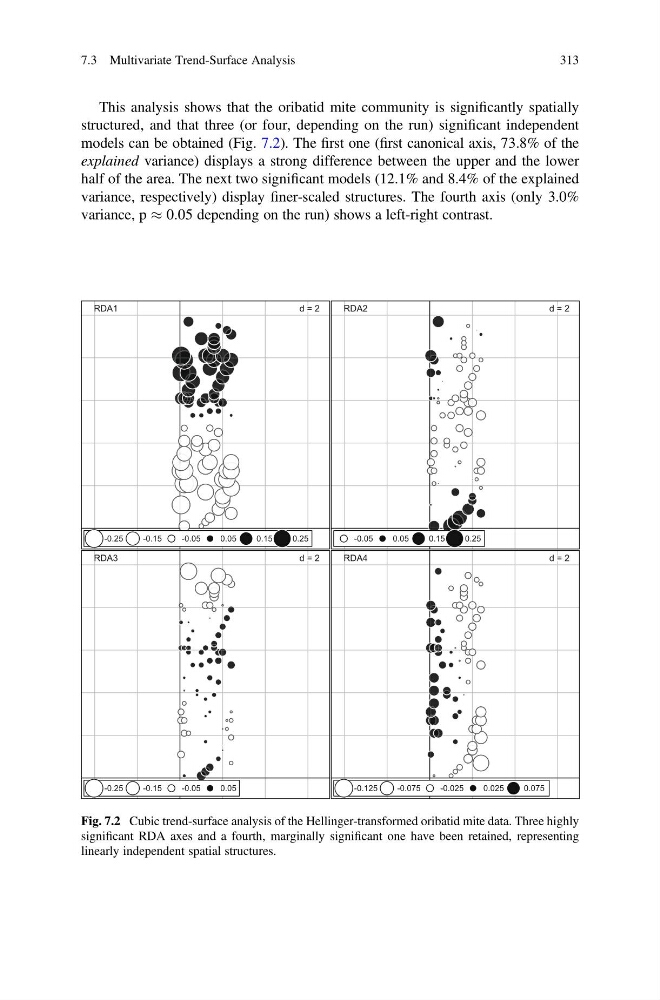
This analysis shows that the oribatid mite community is significantly spatially
structured, and that three (or four, depending on the run) significant independent
models can be obtained (Fig. 7.2). The first one (first canonical axis, 73.8% of the
explained variance) displays a strong difference between the upper and the lower
half of the area. The next two significant models (12.1% and 8.4% of the explained
variance, respectively) display finer-scaled structures. The fourth axis (only 3.0%
variance, p % 0.05 depending on the run) shows a left-right contrast.
d = 2
RDA1
-0.25
-0.15
-0.05
0.05
0.15
0.25
d = 2
RDA2
-0.05
0.05
0.15
0.25
d = 2
RDA3
-0.25
-0.15
-0.05
0.05
d = 2
RDA4
-0.125
-0.075
-0.025
0.025
0.075
Fig. 7.2 Cubic trend-surface analysis of the Hellinger-transformed oribatid mite data. Three highly
significant RDA axes and a fourth, marginally significant one have been retained, representing
linearly independent spatial structures.
7.3 Multivariate Trend-Surface Analysis
313
structured, and that three (or four, depending on the run) significant independent
models can be obtained (Fig. 7.2). The first one (first canonical axis, 73.8% of the
explained variance) displays a strong difference between the upper and the lower
half of the area. The next two significant models (12.1% and 8.4% of the explained
variance, respectively) display finer-scaled structures. The fourth axis (only 3.0%
variance, p % 0.05 depending on the run) shows a left-right contrast.
d = 2
RDA1
-0.25
-0.15
-0.05
0.05
0.15
0.25
d = 2
RDA2
-0.05
0.05
0.15
0.25
d = 2
RDA3
-0.25
-0.15
-0.05
0.05
d = 2
RDA4
-0.125
-0.075
-0.025
0.025
0.075
Fig. 7.2 Cubic trend-surface analysis of the Hellinger-transformed oribatid mite data. Three highly
significant RDA axes and a fourth, marginally significant one have been retained, representing
linearly independent spatial structures.
7.3 Multivariate Trend-Surface Analysis
313