

Hint We use the print() function to display the correlogram results because it
allows for correction of the p-values for multiple testing. In a correlogram, a test
is performed for each lag (distance class), so that without correction, the overall
risk of type I error is greatly increased. The Holm (1979) correction is applied
here.
This correlogram has a single significant distance class: there is positive spatial
correlation at distance class 1 (i.e., 0.0 m to 0.7 m). Negative spatial correlation at
distance class 4 (i.e., 2.1 m to 2.8 m) is hinted at, but the coefficient is not significant
after Holm (1979) correction for multiple testing (see Sect. 7.2.6). Beyond these
marks, no significant spatial correlation exists, which means that for practical
purposes measurements taken more than 0.7 m, or (conservatively) 2.8 m apart
(the upper limit of class 4) can be considered as spatially independent with respect to
substrate density.
Spatial correlation in the multivariate domain can be assessed and tested for by
means of a Mantel correlogram (Sokal 1986; Oden and Sokal 1986; Borcard and
Legendre 2012). Basically, one computes a standardized Mantel statistic r M (analogous to a Pearson’s r coefficient) between a dissimilarity matrix among sites and a
matrix where pairs of sites belonging to the same distance class receive value 0 and
the other pairs, value 1. The process is repeated for each distance class. Each r M
value can be tested for by permutations. The expectation of the Mantel statistic for no
spatial correlation is r M ¼ 0.
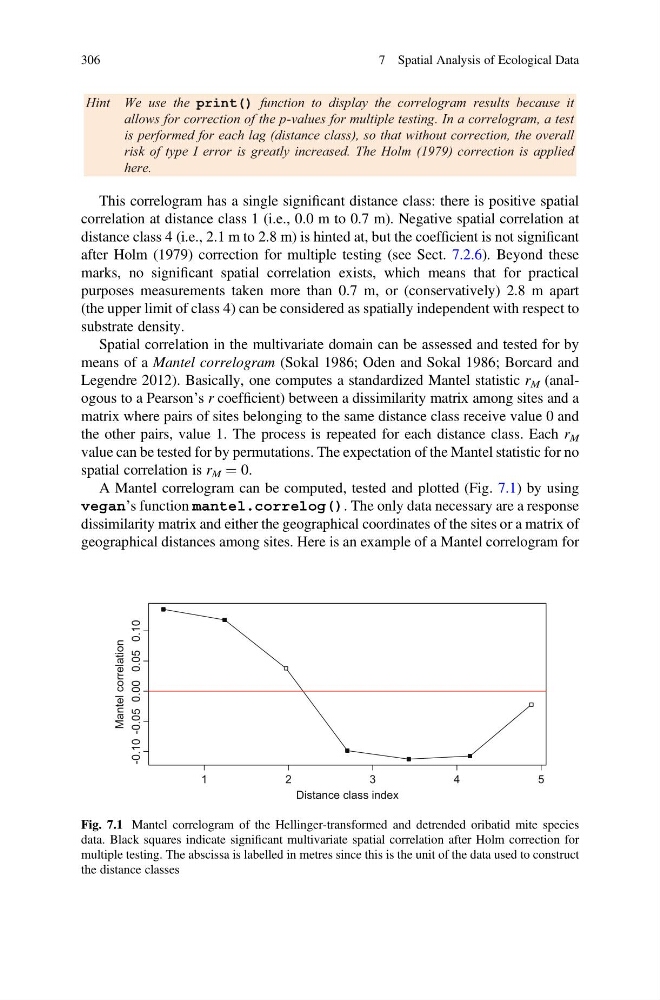
A Mantel correlogram can be computed, tested and plotted (Fig. 7.1) by using
vegan’s function mantel.correlog(). The only data necessary are a response
dissimilarity matrix and either the geographical coordinates of the sites or a matrix of
geographical distances among sites. Here is an example of a Mantel correlogram for
1
2
3
4
5
-0.10 -0.05 0.00 0.05 0.10
Distance class index
Mantel correlation
Fig. 7.1 Mantel correlogram of the Hellinger-transformed and detrended oribatid mite species
data. Black squares indicate significant multivariate spatial correlation after Holm correction for
multiple testing. The abscissa is labelled in metres since this is the unit of the data used to construct
the distance classes
306
7 Spatial Analysis of Ecological Data
allows for correction of the p-values for multiple testing. In a correlogram, a test
is performed for each lag (distance class), so that without correction, the overall
risk of type I error is greatly increased. The Holm (1979) correction is applied
here.
This correlogram has a single significant distance class: there is positive spatial
correlation at distance class 1 (i.e., 0.0 m to 0.7 m). Negative spatial correlation at
distance class 4 (i.e., 2.1 m to 2.8 m) is hinted at, but the coefficient is not significant
after Holm (1979) correction for multiple testing (see Sect. 7.2.6). Beyond these
marks, no significant spatial correlation exists, which means that for practical
purposes measurements taken more than 0.7 m, or (conservatively) 2.8 m apart
(the upper limit of class 4) can be considered as spatially independent with respect to
substrate density.
Spatial correlation in the multivariate domain can be assessed and tested for by
means of a Mantel correlogram (Sokal 1986; Oden and Sokal 1986; Borcard and
Legendre 2012). Basically, one computes a standardized Mantel statistic r M (analogous to a Pearson’s r coefficient) between a dissimilarity matrix among sites and a
matrix where pairs of sites belonging to the same distance class receive value 0 and
the other pairs, value 1. The process is repeated for each distance class. Each r M
value can be tested for by permutations. The expectation of the Mantel statistic for no
spatial correlation is r M ¼ 0.
A Mantel correlogram can be computed, tested and plotted (Fig. 7.1) by using
vegan’s function mantel.correlog(). The only data necessary are a response
dissimilarity matrix and either the geographical coordinates of the sites or a matrix of
geographical distances among sites. Here is an example of a Mantel correlogram for
1
2
3
4
5
-0.10 -0.05 0.00 0.05 0.10
Distance class index
Mantel correlation
Fig. 7.1 Mantel correlogram of the Hellinger-transformed and detrended oribatid mite species
data. Black squares indicate significant multivariate spatial correlation after Holm correction for
multiple testing. The abscissa is labelled in metres since this is the unit of the data used to construct
the distance classes
306
7 Spatial Analysis of Ecological Data