

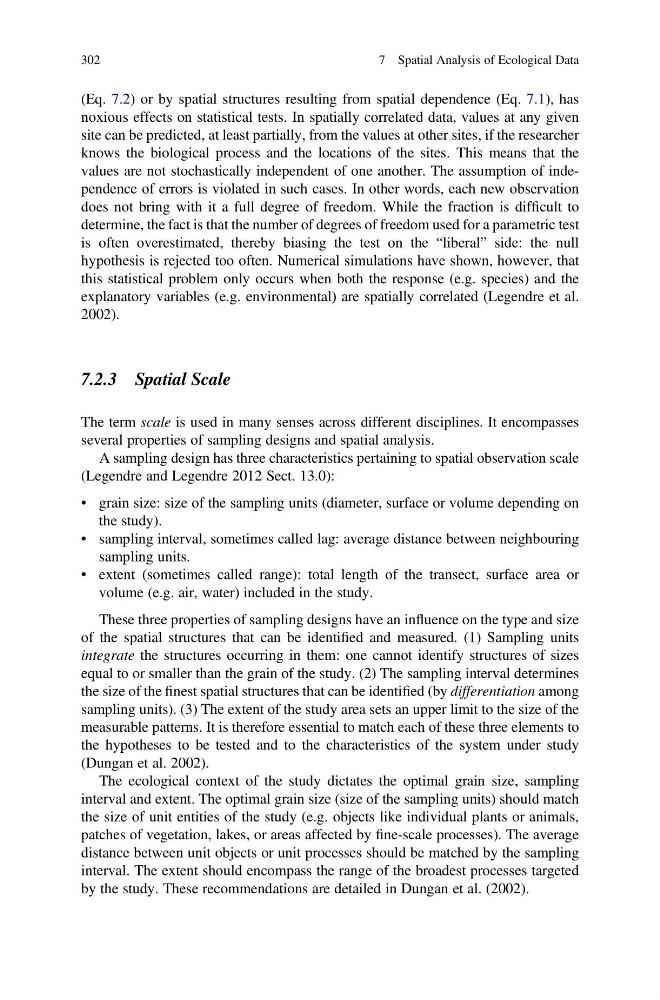
(Eq. 7.2) or by spatial structures resulting from spatial dependence (Eq. 7.1), has
noxious effects on statistical tests. In spatially correlated data, values at any given
site can be predicted, at least partially, from the values at other sites, if the researcher
knows the biological process and the locations of the sites. This means that the
values are not stochastically independent of one another. The assumption of independence of errors is violated in such cases. In other words, each new observation
does not bring with it a full degree of freedom. While the fraction is difficult to
determine, the fact is that the number of degrees of freedom used for a parametric test
is often overestimated, thereby biasing the test on the “liberal” side: the null
hypothesis is rejected too often. Numerical simulations have shown, however, that
this statistical problem only occurs when both the response (e.g. species) and the
explanatory variables (e.g. environmental) are spatially correlated (Legendre et al.
2002).
7.2.3 Spatial Scale
The term scale is used in many senses across different disciplines. It encompasses
several properties of sampling designs and spatial analysis.
A sampling design has three characteristics pertaining to spatial observation scale
(Legendre and Legendre 2012 Sect. 13.0):
• grain size: size of the sampling units (diameter, surface or volume depending on
the study).
• sampling interval, sometimes called lag: average distance between neighbouring
sampling units.
• extent (sometimes called range): total length of the transect, surface area or
volume (e.g. air, water) included in the study.
These three properties of sampling designs have an influence on the type and size
of the spatial structures that can be identified and measured. (1) Sampling units
integrate the structures occurring in them: one cannot identify structures of sizes
equal to or smaller than the grain of the study. (2) The sampling interval determines
the size of the finest spatial structures that can be identified (by differentiation among
sampling units). (3) The extent of the study area sets an upper limit to the size of the
measurable patterns. It is therefore essential to match each of these three elements to
the hypotheses to be tested and to the characteristics of the system under study
(Dungan et al. 2002).
The ecological context of the study dictates the optimal grain size, sampling
interval and extent. The optimal grain size (size of the sampling units) should match
the size of unit entities of the study (e.g. objects like individual plants or animals,
patches of vegetation, lakes, or areas affected by fine-scale processes). The average
distance between unit objects or unit processes should be matched by the sampling
interval. The extent should encompass the range of the broadest processes targeted
by the study. These recommendations are detailed in Dungan et al. (2002).
302
7 Spatial Analysis of Ecological Data
noxious effects on statistical tests. In spatially correlated data, values at any given
site can be predicted, at least partially, from the values at other sites, if the researcher
knows the biological process and the locations of the sites. This means that the
values are not stochastically independent of one another. The assumption of independence of errors is violated in such cases. In other words, each new observation
does not bring with it a full degree of freedom. While the fraction is difficult to
determine, the fact is that the number of degrees of freedom used for a parametric test
is often overestimated, thereby biasing the test on the “liberal” side: the null
hypothesis is rejected too often. Numerical simulations have shown, however, that
this statistical problem only occurs when both the response (e.g. species) and the
explanatory variables (e.g. environmental) are spatially correlated (Legendre et al.
2002).
7.2.3 Spatial Scale
The term scale is used in many senses across different disciplines. It encompasses
several properties of sampling designs and spatial analysis.
A sampling design has three characteristics pertaining to spatial observation scale
(Legendre and Legendre 2012 Sect. 13.0):
• grain size: size of the sampling units (diameter, surface or volume depending on
the study).
• sampling interval, sometimes called lag: average distance between neighbouring
sampling units.
• extent (sometimes called range): total length of the transect, surface area or
volume (e.g. air, water) included in the study.
These three properties of sampling designs have an influence on the type and size
of the spatial structures that can be identified and measured. (1) Sampling units
integrate the structures occurring in them: one cannot identify structures of sizes
equal to or smaller than the grain of the study. (2) The sampling interval determines
the size of the finest spatial structures that can be identified (by differentiation among
sampling units). (3) The extent of the study area sets an upper limit to the size of the
measurable patterns. It is therefore essential to match each of these three elements to
the hypotheses to be tested and to the characteristics of the system under study
(Dungan et al. 2002).
The ecological context of the study dictates the optimal grain size, sampling
interval and extent. The optimal grain size (size of the sampling units) should match
the size of unit entities of the study (e.g. objects like individual plants or animals,
patches of vegetation, lakes, or areas affected by fine-scale processes). The average
distance between unit objects or unit processes should be matched by the sampling
interval. The extent should encompass the range of the broadest processes targeted
by the study. These recommendations are detailed in Dungan et al. (2002).
302
7 Spatial Analysis of Ecological Data