

6.6.2 Co-correspondence Analysis (CoCA)
Co-correspondence analysis is based on correspondence analysis (CA) and is devoted
to the simultaneous ordination of two communities sampled at the same sites (ter Braak
and Schaffers 2004). Its asymmetric form allows one to predict a community on the
basis of the other. The method has been developed to fill a gap: usually ecologists
explain community data by means of environmental variables of various types
(e.g. climate, soil, chemistry, anthropogenic influence, but not other species data) or,
in a reversed calibration and prediction approach, they estimate the values of environmental variables by means of bioindicator species or communities (see Sect. 6.3.2.7 for
an example). But in some cases one could be interested in assessing the relationship
between two living communities, e.g. invertebrates and plants. This may be done for
instance to verify if an invertebrate community is more related to the plant community
or to other, e.g. physico-chemical constraints, or else to predict one community that is
difficult to sample by means of another, easier one. Co-correspondence analysis can be
run in a symmetric way (as Co-inertia analysis (CoIA, Sect. 6.9) does for other types of
data, or in an asymmetric way, the one that interests us in this section.
-5
0
5
10
15
20
25
-3
-2
-1
0
1
2
week
Effect
caenhora
NauLa
cloedipt
Strvi
mystloni
ablaphmo
Simve
cepogoae
chaoobsc
caenluct
hytuinae
Ostsp
chironsp
armicris
conagrae
aselaqua
sphidae
Copsp
hycarina
hebdstag
CilHa
Polar
Ascmo
Synsp
alglhete
Cepsp
erpoocto
olchaeta
amosp
binitent
dose
0
0.1
0.9
6
44
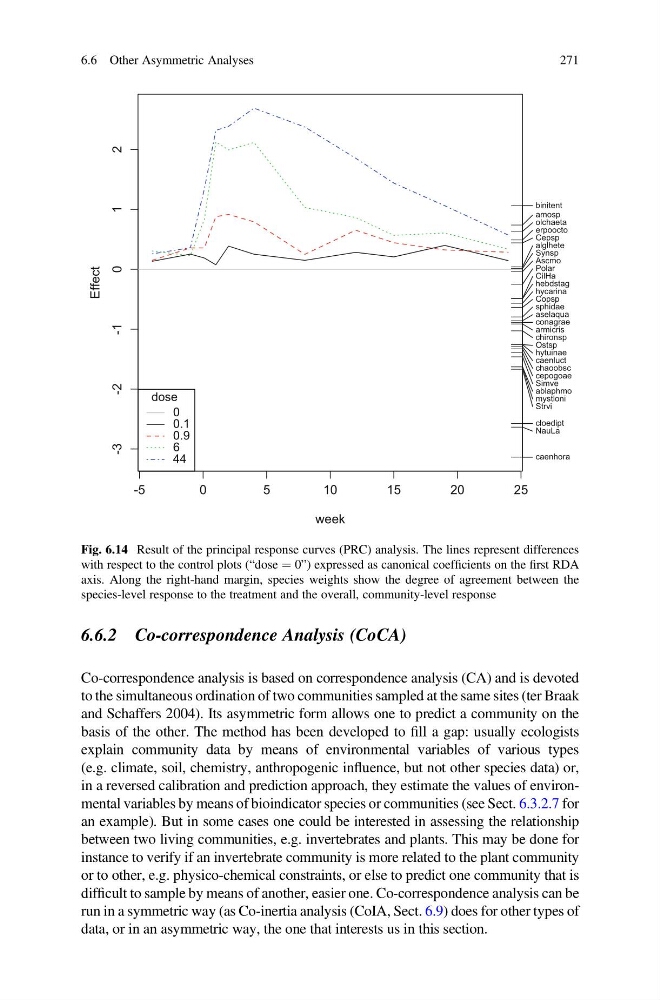
Fig. 6.14 Result of the principal response curves (PRC) analysis. The lines represent differences
with respect to the control plots (“dose ¼ 0”) expressed as canonical coefficients on the first RDA
axis. Along the right-hand margin, species weights show the degree of agreement between the
species-level response to the treatment and the overall, community-level response
6.6 Other Asymmetric Analyses
271
Co-correspondence analysis is based on correspondence analysis (CA) and is devoted
to the simultaneous ordination of two communities sampled at the same sites (ter Braak
and Schaffers 2004). Its asymmetric form allows one to predict a community on the
basis of the other. The method has been developed to fill a gap: usually ecologists
explain community data by means of environmental variables of various types
(e.g. climate, soil, chemistry, anthropogenic influence, but not other species data) or,
in a reversed calibration and prediction approach, they estimate the values of environmental variables by means of bioindicator species or communities (see Sect. 6.3.2.7 for
an example). But in some cases one could be interested in assessing the relationship
between two living communities, e.g. invertebrates and plants. This may be done for
instance to verify if an invertebrate community is more related to the plant community
or to other, e.g. physico-chemical constraints, or else to predict one community that is
difficult to sample by means of another, easier one. Co-correspondence analysis can be
run in a symmetric way (as Co-inertia analysis (CoIA, Sect. 6.9) does for other types of
data, or in an asymmetric way, the one that interests us in this section.
-5
0
5
10
15
20
25
-3
-2
-1
0
1
2
week
Effect
caenhora
NauLa
cloedipt
Strvi
mystloni
ablaphmo
Simve
cepogoae
chaoobsc
caenluct
hytuinae
Ostsp
chironsp
armicris
conagrae
aselaqua
sphidae
Copsp
hycarina
hebdstag
CilHa
Polar
Ascmo
Synsp
alglhete
Cepsp
erpoocto
olchaeta
amosp
binitent
dose
0
0.1
0.9
6
44
Fig. 6.14 Result of the principal response curves (PRC) analysis. The lines represent differences
with respect to the control plots (“dose ¼ 0”) expressed as canonical coefficients on the first RDA
axis. Along the right-hand margin, species weights show the degree of agreement between the
species-level response to the treatment and the overall, community-level response
6.6 Other Asymmetric Analyses
271