

# LDA with jackknife-based classification (i.e., leave-one-out
# cross-validation)
(spe.lda.jac
CV = TRUE))
summary(spe.lda.jac)
# Numbers and proportions of correct classification
spe.jac.class <- spe.lda.jac$class
spe.jac.table <- table(gr, spe.jac.class)
# Classification success
diag(prop.table(spe.jac.table, 1))
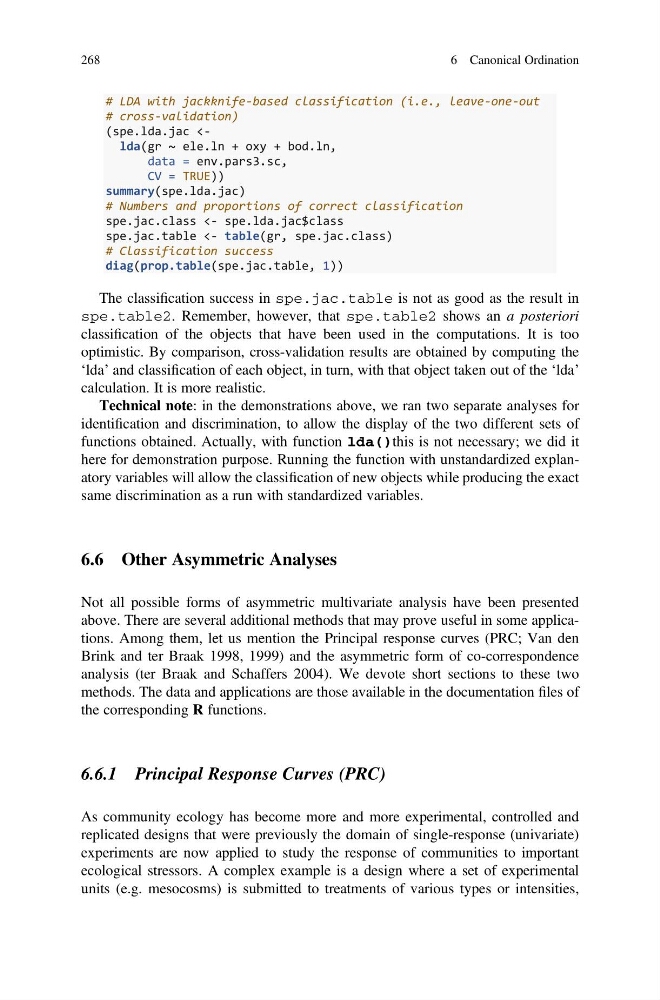
The classification success in spe.jac.table is not as good as the result in
spe.table2. Remember, however, that spe.table2 shows an a posteriori
classification of the objects that have been used in the computations. It is too
optimistic. By comparison, cross-validation results are obtained by computing the
‘lda’ and classification of each object, in turn, with that object taken out of the ‘lda’
calculation. It is more realistic.
Technical note: in the demonstrations above, we ran two separate analyses for
identification and discrimination, to allow the display of the two different sets of
functions obtained. Actually, with function lda()this is not necessary; we did it
here for demonstration purpose. Running the function with unstandardized explanatory variables will allow the classification of new objects while producing the exact
same discrimination as a run with standardized variables.
6.6 Other Asymmetric Analyses
Not all possible forms of asymmetric multivariate analysis have been presented
above. There are several additional methods that may prove useful in some applications. Among them, let us mention the Principal response curves (PRC; Van den
Brink and ter Braak 1998, 1999) and the asymmetric form of co-correspondence
analysis (ter Braak and Schaffers 2004). We devote short sections to these two
methods. The data and applications are those available in the documentation files of
the corresponding R functions.
6.6.1 Principal Response Curves (PRC)
As community ecology has become more and more experimental, controlled and
replicated designs that were previously the domain of single-response (univariate)
experiments are now applied to study the response of communities to important
ecological stressors. A complex example is a design where a set of experimental
units (e.g. mesocosms) is submitted to treatments of various types or intensities,
268
6 Canonical Ordination
# cross-validation)
(spe.lda.jac
CV = TRUE))
summary(spe.lda.jac)
# Numbers and proportions of correct classification
spe.jac.class <- spe.lda.jac$class
spe.jac.table <- table(gr, spe.jac.class)
# Classification success
diag(prop.table(spe.jac.table, 1))
The classification success in spe.jac.table is not as good as the result in
spe.table2. Remember, however, that spe.table2 shows an a posteriori
classification of the objects that have been used in the computations. It is too
optimistic. By comparison, cross-validation results are obtained by computing the
‘lda’ and classification of each object, in turn, with that object taken out of the ‘lda’
calculation. It is more realistic.
Technical note: in the demonstrations above, we ran two separate analyses for
identification and discrimination, to allow the display of the two different sets of
functions obtained. Actually, with function lda()this is not necessary; we did it
here for demonstration purpose. Running the function with unstandardized explanatory variables will allow the classification of new objects while producing the exact
same discrimination as a run with standardized variables.
6.6 Other Asymmetric Analyses
Not all possible forms of asymmetric multivariate analysis have been presented
above. There are several additional methods that may prove useful in some applications. Among them, let us mention the Principal response curves (PRC; Van den
Brink and ter Braak 1998, 1999) and the asymmetric form of co-correspondence
analysis (ter Braak and Schaffers 2004). We devote short sections to these two
methods. The data and applications are those available in the documentation files of
the corresponding R functions.
6.6.1 Principal Response Curves (PRC)
As community ecology has become more and more experimental, controlled and
replicated designs that were previously the domain of single-response (univariate)
experiments are now applied to study the response of communities to important
ecological stressors. A complex example is a design where a set of experimental
units (e.g. mesocosms) is submitted to treatments of various types or intensities,
268
6 Canonical Ordination