

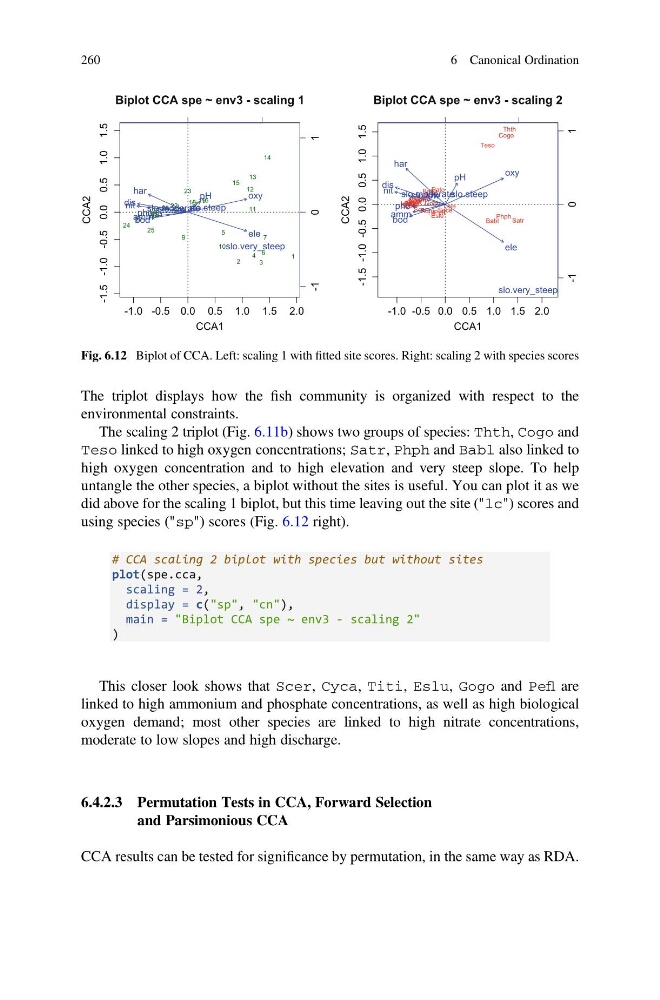
The triplot displays how the fish community is organized with respect to the
environmental constraints.
The scaling 2 triplot (Fig. 6.11b) shows two groups of species: Thth, Cogo and
Teso linked to high oxygen concentrations; Satr, Phph and Babl also linked to
high oxygen concentration and to high elevation and very steep slope. To help
untangle the other species, a biplot without the sites is useful. You can plot it as we
did above for the scaling 1 biplot, but this time leaving out the site ("lc") scores and
using species ("sp") scores (Fig. 6.12 right).
# CCA scaling 2 biplot with species but without sites
plot(spe.cca,
scaling = 2,
display = c("sp", "cn"),
main = "Biplot CCA spe ~ env3 - scaling 2"
)
This closer look shows that Scer, Cyca, Titi, Eslu, Gogo and Pefl are
linked to high ammonium and phosphate concentrations, as well as high biological
oxygen demand; most other species are linked to high nitrate concentrations,
moderate to low slopes and high discharge.
6.4.2.3 Permutation Tests in CCA, Forward Selection
and Parsimonious CCA
CCA results can be tested for significance by permutation, in the same way as RDA.
-1.0 -0.5 0.0 0.5 1.0 1.5 2.0
-1.5 -1.0 -0.5 0.0 0.5 1.0 1.5
Biplot CCA spe ~ env3 - scaling 1
CCA1
CCA2
1
2
3
4
5
6
7
9
10
11
12
13
14
15
16
17
18 19
20
21
22
23
24
25
26
27
28 29
30
ele
dis
pH
har
pho
nit
amm
oxy
bod
-1
0
1
slo.low
slo.moderate slo.steep
slo.very_steep
-1.0 -0.5 0.0 0.5 1.0 1.5 2.0
-1.5
-1.0 -0.5 0.0 0.5 1.0 1.5
Biplot CCA spe ~ env3 - scaling 2
CCA1
CCA2
Cogo
Satr
Phph
Babl
Thth
Teso
Chna
Pato
Lele
Sqce
Baba
Albi
Gogo
Eslu
Pefl
Rham Legi
Scer
Cyca
Titi
Abbr
Icme Gyce
Ruru
Blbj Alal
Anan
ele
dis
pH
har
pho
nit
amm
oxy
bod
-1
0
1
slo.low
slo.moderate slo.steep
slo.very_steep
Fig. 6.12 Biplot of CCA. Left: scaling 1 with fitted site scores. Right: scaling 2 with species scores
260
6 Canonical Ordination
environmental constraints.
The scaling 2 triplot (Fig. 6.11b) shows two groups of species: Thth, Cogo and
Teso linked to high oxygen concentrations; Satr, Phph and Babl also linked to
high oxygen concentration and to high elevation and very steep slope. To help
untangle the other species, a biplot without the sites is useful. You can plot it as we
did above for the scaling 1 biplot, but this time leaving out the site ("lc") scores and
using species ("sp") scores (Fig. 6.12 right).
# CCA scaling 2 biplot with species but without sites
plot(spe.cca,
scaling = 2,
display = c("sp", "cn"),
main = "Biplot CCA spe ~ env3 - scaling 2"
)
This closer look shows that Scer, Cyca, Titi, Eslu, Gogo and Pefl are
linked to high ammonium and phosphate concentrations, as well as high biological
oxygen demand; most other species are linked to high nitrate concentrations,
moderate to low slopes and high discharge.
6.4.2.3 Permutation Tests in CCA, Forward Selection
and Parsimonious CCA
CCA results can be tested for significance by permutation, in the same way as RDA.
-1.0 -0.5 0.0 0.5 1.0 1.5 2.0
-1.5 -1.0 -0.5 0.0 0.5 1.0 1.5
Biplot CCA spe ~ env3 - scaling 1
CCA1
CCA2
1
2
3
4
5
6
7
9
10
11
12
13
14
15
16
17
18 19
20
21
22
23
24
25
26
27
28 29
30
ele
dis
pH
har
pho
nit
amm
oxy
bod
-1
0
1
slo.low
slo.moderate slo.steep
slo.very_steep
-1.0 -0.5 0.0 0.5 1.0 1.5 2.0
-1.5
-1.0 -0.5 0.0 0.5 1.0 1.5
Biplot CCA spe ~ env3 - scaling 2
CCA1
CCA2
Cogo
Satr
Phph
Babl
Thth
Teso
Chna
Pato
Lele
Sqce
Baba
Albi
Gogo
Eslu
Pefl
Rham Legi
Scer
Cyca
Titi
Abbr
Icme Gyce
Ruru
Blbj Alal
Anan
ele
dis
pH
har
pho
nit
amm
oxy
bod
-1
0
1
slo.low
slo.moderate slo.steep
slo.very_steep
Fig. 6.12 Biplot of CCA. Left: scaling 1 with fitted site scores. Right: scaling 2 with species scores
260
6 Canonical Ordination