

when applied to multifactorial ANOVA designs. The method based on PCoA data
obtained with the Lingoes correction shares the same property, whereas tests on data
obtained with the Cailliez correction produce inflated type I error rates (McArdle and
Anderson 2001).
For the sake of example, we will compute a db-RDA on the fish data (reduced to
27 sites) constrained by the factor ele created in Sect. 6.3.2.9. Let us do it on the
basis of a percentage difference dissimilarity matrix. Now, we remember from
Chap. 3 that this measure is not Euclidean, which will result in the production of
one or several negative eigenvalues if no correction is applied. The corrections may
consist in square-rooting the dissimilarity matrix or applying the Lingoes correction
(Sect. 5.5).
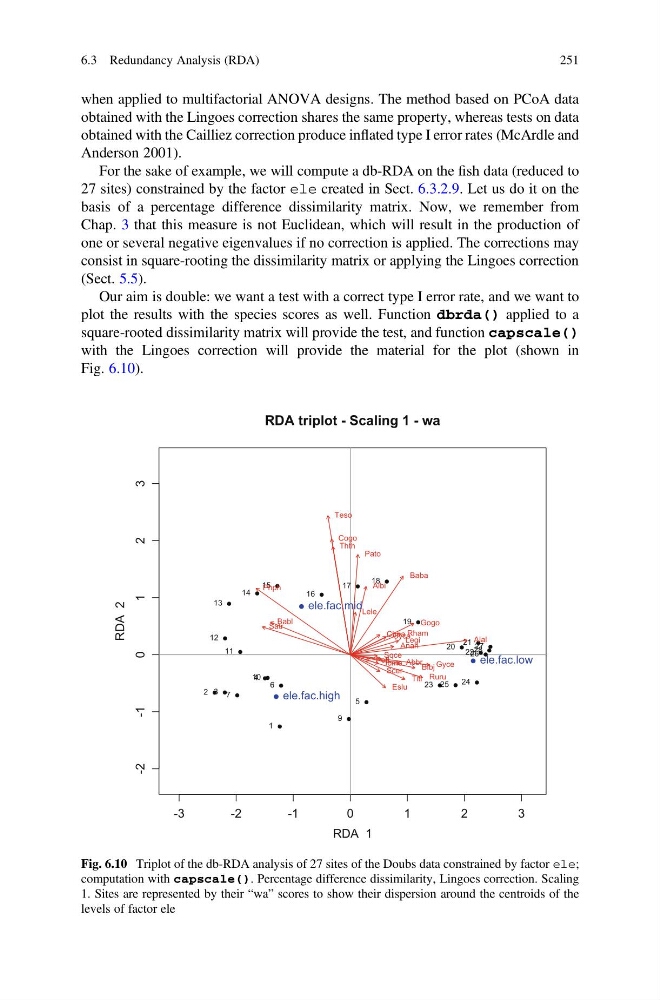
Our aim is double: we want a test with a correct type I error rate, and we want to
plot the results with the species scores as well. Function dbrda() applied to a
square-rooted dissimilarity matrix will provide the test, and function capscale()
with the Lingoes correction will provide the material for the plot (shown in
Fig. 6.10).
- 3
- 2
- 1
0
1
2
3
-2
-1
0
1
2
3
RDA triplot - Scaling 1 - wa
RDA 1
RDA 2
1
2 3
4
5
6
7
9
10
11
12
13
14
15
16
17
18
19
20
21
22
23
24
25
26
27
28
Cogo
Satr
Phph
Babl
Thth
Teso
Chna
Pato
Lele
Sqce
Baba
Albi
Gogo
Eslu
Pefl
Rham
Legi
Scer
Cyca
Titi
Abbr
Icme
Gyce
Ruru
Blbj
Alal
Anan
ele.fac.high
ele.fac.mid
ele.fac.low
Fig. 6.10 Triplot of the db-RDA analysis of 27 sites of the Doubs data constrained by factor ele;
computation with capscale(). Percentage difference dissimilarity, Lingoes correction. Scaling
1. Sites are represented by their “wa” scores to show their dispersion around the centroids of the
levels of factor ele
6.3 Redundancy Analysis (RDA)
251
obtained with the Lingoes correction shares the same property, whereas tests on data
obtained with the Cailliez correction produce inflated type I error rates (McArdle and
Anderson 2001).
For the sake of example, we will compute a db-RDA on the fish data (reduced to
27 sites) constrained by the factor ele created in Sect. 6.3.2.9. Let us do it on the
basis of a percentage difference dissimilarity matrix. Now, we remember from
Chap. 3 that this measure is not Euclidean, which will result in the production of
one or several negative eigenvalues if no correction is applied. The corrections may
consist in square-rooting the dissimilarity matrix or applying the Lingoes correction
(Sect. 5.5).
Our aim is double: we want a test with a correct type I error rate, and we want to
plot the results with the species scores as well. Function dbrda() applied to a
square-rooted dissimilarity matrix will provide the test, and function capscale()
with the Lingoes correction will provide the material for the plot (shown in
Fig. 6.10).
- 3
- 2
- 1
0
1
2
3
-2
-1
0
1
2
3
RDA triplot - Scaling 1 - wa
RDA 1
RDA 2
1
2 3
4
5
6
7
9
10
11
12
13
14
15
16
17
18
19
20
21
22
23
24
25
26
27
28
Cogo
Satr
Phph
Babl
Thth
Teso
Chna
Pato
Lele
Sqce
Baba
Albi
Gogo
Eslu
Pefl
Rham
Legi
Scer
Cyca
Titi
Abbr
Icme
Gyce
Ruru
Blbj
Alal
Anan
ele.fac.high
ele.fac.mid
ele.fac.low
Fig. 6.10 Triplot of the db-RDA analysis of 27 sites of the Doubs data constrained by factor ele;
computation with capscale(). Percentage difference dissimilarity, Lingoes correction. Scaling
1. Sites are represented by their “wa” scores to show their dispersion around the centroids of the
levels of factor ele
6.3 Redundancy Analysis (RDA)
251