

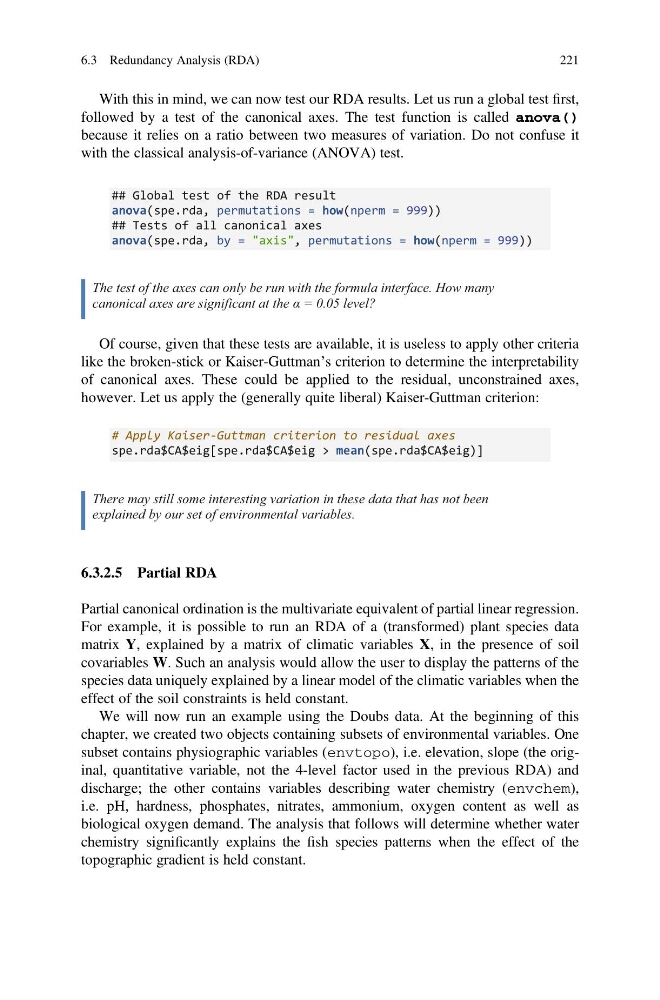
With this in mind, we can now test our RDA results. Let us run a global test first,
followed by a test of the canonical axes. The test function is called anova()
because it relies on a ratio between two measures of variation. Do not confuse it
with the classical analysis-of-variance (ANOVA) test.
## Global test of the RDA result
anova(spe.rda, permutations = how(nperm = 999))
## Tests of all canonical axes
anova(spe.rda, by = "axis", permutations = how(nperm = 999))
The test of the axes can only be run with the formula interface. How many
canonical axes are significant at the α = 0.05 level?
Of course, given that these tests are available, it is useless to apply other criteria
like the broken-stick or Kaiser-Guttman’s criterion to determine the interpretability
of canonical axes. These could be applied to the residual, unconstrained axes,
however. Let us apply the (generally quite liberal) Kaiser-Guttman criterion:
# Apply Kaiser-Guttman criterion to residual axes
spe.rda$CA$eig[spe.rda$CA$eig > mean(spe.rda$CA$eig)]
There may still some interesting variation in these data that has not been
explained by our set of environmental variables.
6.3.2.5 Partial RDA
Partial canonical ordination is the multivariate equivalent of partial linear regression.
For example, it is possible to run an RDA of a (transformed) plant species data
matrix Y, explained by a matrix of climatic variables X, in the presence of soil
covariables W. Such an analysis would allow the user to display the patterns of the
species data uniquely explained by a linear model of the climatic variables when the
effect of the soil constraints is held constant.
We will now run an example using the Doubs data. At the beginning of this
chapter, we created two objects containing subsets of environmental variables. One
subset contains physiographic variables (envtopo), i.e. elevation, slope (the original, quantitative variable, not the 4-level factor used in the previous RDA) and
discharge; the other contains variables describing water chemistry (envchem),
i.e. pH, hardness, phosphates, nitrates, ammonium, oxygen content as well as
biological oxygen demand. The analysis that follows will determine whether water
chemistry significantly explains the fish species patterns when the effect of the
topographic gradient is held constant.
6.3 Redundancy Analysis (RDA)
221
followed by a test of the canonical axes. The test function is called anova()
because it relies on a ratio between two measures of variation. Do not confuse it
with the classical analysis-of-variance (ANOVA) test.
## Global test of the RDA result
anova(spe.rda, permutations = how(nperm = 999))
## Tests of all canonical axes
anova(spe.rda, by = "axis", permutations = how(nperm = 999))
The test of the axes can only be run with the formula interface. How many
canonical axes are significant at the α = 0.05 level?
Of course, given that these tests are available, it is useless to apply other criteria
like the broken-stick or Kaiser-Guttman’s criterion to determine the interpretability
of canonical axes. These could be applied to the residual, unconstrained axes,
however. Let us apply the (generally quite liberal) Kaiser-Guttman criterion:
# Apply Kaiser-Guttman criterion to residual axes
spe.rda$CA$eig[spe.rda$CA$eig > mean(spe.rda$CA$eig)]
There may still some interesting variation in these data that has not been
explained by our set of environmental variables.
6.3.2.5 Partial RDA
Partial canonical ordination is the multivariate equivalent of partial linear regression.
For example, it is possible to run an RDA of a (transformed) plant species data
matrix Y, explained by a matrix of climatic variables X, in the presence of soil
covariables W. Such an analysis would allow the user to display the patterns of the
species data uniquely explained by a linear model of the climatic variables when the
effect of the soil constraints is held constant.
We will now run an example using the Doubs data. At the beginning of this
chapter, we created two objects containing subsets of environmental variables. One
subset contains physiographic variables (envtopo), i.e. elevation, slope (the original, quantitative variable, not the 4-level factor used in the previous RDA) and
discharge; the other contains variables describing water chemistry (envchem),
i.e. pH, hardness, phosphates, nitrates, ammonium, oxygen content as well as
biological oxygen demand. The analysis that follows will determine whether water
chemistry significantly explains the fish species patterns when the effect of the
topographic gradient is held constant.
6.3 Redundancy Analysis (RDA)
221