

• Biplot scores for constraining variables: coordinates of the tips of the vectors
representing the explanatory variables. These coordinates are obtained by computing correlations between the explanatory variables and the fitted site scores
(Legendre and Legendre 2012 Eq. 11.21); in scaling 2 these correlations are the
biplot scores; in scaling 1 these correlations are transformed to produce the biplot
scores (Legendre and Legendre 2012 Eq. 11.20). All variables, including k À 1
levels of factors with k levels, are represented in this table. For factors, however, a
representation of the centroids of the levels is preferable. See below.
• Centroids for factor constraints: coordinates of centroids of levels of factor
variables, i.e., means of the scores of the sites possessing state “1” for a given
level.
In the rda() output, an interesting information is missing: the canonical coefficients, i.e., the equivalent of regression coefficients for each explanatory variable
on each canonical axis. These coefficients (Legendre and Legendre 2012 Eq. 11.19)
can be retrieved by typing coef():
# Canonical coefficients from the rda object
coef(spe.rda)
Hint Type ?coef.cca and see how to obtain fitted and residual values. There is also
a calibrate() function allowing the projection of new sites into a canonical
ordination result for bioindication purposes, although with some conditions. See
Sect. 6.3.2.7.
6.3.2.3 Retrieving, Interpreting and Plotting Results From a vegan RDA
Output Object
The various elements making up the rda() output object can be retrieved in the
same way as for a PCA. This is useful when you want to use the results outside the
functions provided by vegan to handle them.
As mentioned above, the R
2 of a RDA is biased like the ordinary R
2 of multiple
regression, and for the same reason (Peres-Neto et al. 2006). On the one hand, any
variable included in an explanatory matrix X increases the R
2 , irrespective of it being
related, or not, to the response data. On the other hand, the accumulation of
explanatory variables inflates the apparent amount of explained variance because
of random correlations. This problem can be cured by adjusting the R
2 using
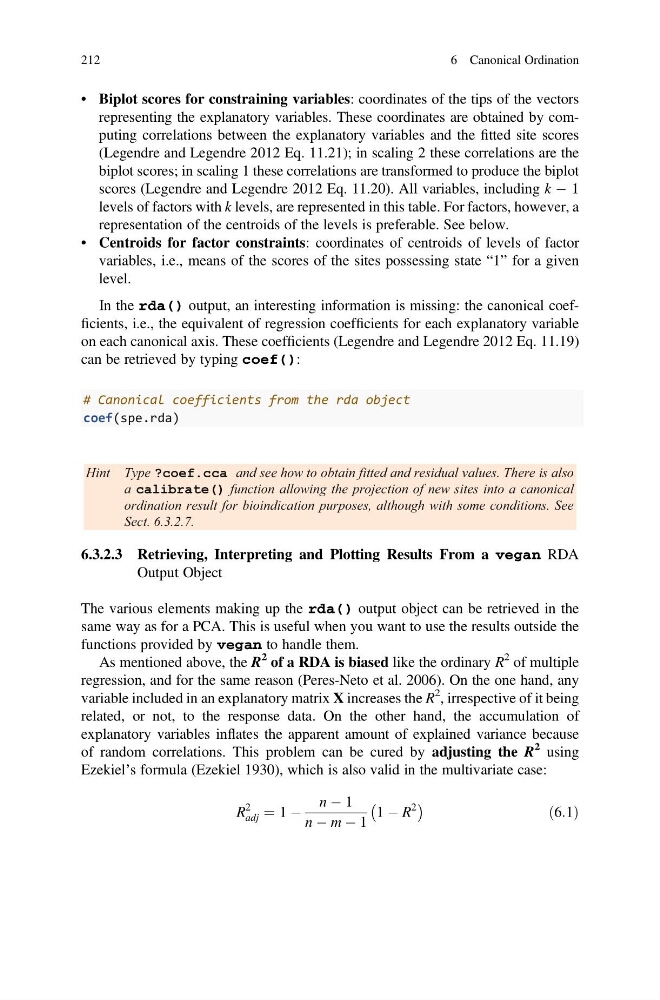
Ezekiel’s formula (Ezekiel 1930), which is also valid in the multivariate case:
R
2
adj ¼ 1 À
n À 1
n À m À 1
1 À R
2
À
Á
ð6:1Þ
212
6 Canonical Ordination
representing the explanatory variables. These coordinates are obtained by computing correlations between the explanatory variables and the fitted site scores
(Legendre and Legendre 2012 Eq. 11.21); in scaling 2 these correlations are the
biplot scores; in scaling 1 these correlations are transformed to produce the biplot
scores (Legendre and Legendre 2012 Eq. 11.20). All variables, including k À 1
levels of factors with k levels, are represented in this table. For factors, however, a
representation of the centroids of the levels is preferable. See below.
• Centroids for factor constraints: coordinates of centroids of levels of factor
variables, i.e., means of the scores of the sites possessing state “1” for a given
level.
In the rda() output, an interesting information is missing: the canonical coefficients, i.e., the equivalent of regression coefficients for each explanatory variable
on each canonical axis. These coefficients (Legendre and Legendre 2012 Eq. 11.19)
can be retrieved by typing coef():
# Canonical coefficients from the rda object
coef(spe.rda)
Hint Type ?coef.cca and see how to obtain fitted and residual values. There is also
a calibrate() function allowing the projection of new sites into a canonical
ordination result for bioindication purposes, although with some conditions. See
Sect. 6.3.2.7.
6.3.2.3 Retrieving, Interpreting and Plotting Results From a vegan RDA
Output Object
The various elements making up the rda() output object can be retrieved in the
same way as for a PCA. This is useful when you want to use the results outside the
functions provided by vegan to handle them.
As mentioned above, the R
2 of a RDA is biased like the ordinary R
2 of multiple
regression, and for the same reason (Peres-Neto et al. 2006). On the one hand, any
variable included in an explanatory matrix X increases the R
2 , irrespective of it being
related, or not, to the response data. On the other hand, the accumulation of
explanatory variables inflates the apparent amount of explained variance because
of random correlations. This problem can be cured by adjusting the R
2 using
Ezekiel’s formula (Ezekiel 1930), which is also valid in the multivariate case:
R
2
adj ¼ 1 À
n À 1
n À m À 1
1 À R
2
À
Á
ð6:1Þ
212
6 Canonical Ordination