

How does this result compare with those of PCA, CA and PCoA?
If one must use a dissimilarity matrix with missing values, NMDS can be
computed with the function isoMDS(). An initial configuration must be provided
in the form of a matrix positioning the sites (argument y) in the number of
dimensions specified for the analysis (argument k). By default isoMDS() computes this initial configuration by PCoA, using function cmdscale(). To reduce
the risk of reaching a local minimum, we suggest to use the function bestnmds()
of the package labdsv. This function, which is a wrapper for isoMDS(),
computes the analysis a user-specified number of times (argument itr) with
internally produced random initial configurations. The solution with the smallest
stress value is retained by the function.
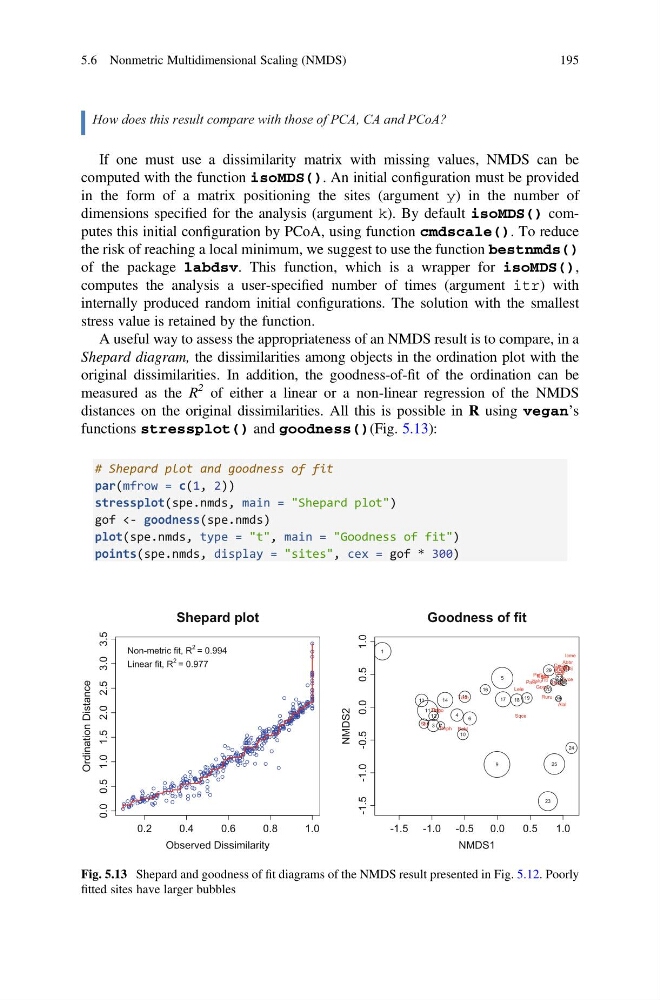
A useful way to assess the appropriateness of an NMDS result is to compare, in a
Shepard diagram, the dissimilarities among objects in the ordination plot with the
original dissimilarities. In addition, the goodness-of-fit of the ordination can be
measured as the R
2 of either a linear or a non-linear regression of the NMDS
distances on the original dissimilarities. All this is possible in R using vegan’s
functions stressplot() and goodness()(Fig. 5.13):
# Shepard plot and goodness of fit
par(mfrow = c(1, 2))
stressplot(spe.nmds, main = "Shepard plot")
gof <- goodness(spe.nmds)
plot(spe.nmds, type = "t", main = "Goodness of fit")
points(spe.nmds, display = "sites", cex = gof * 300)
0.2
0.4
0.6
0.8
1.0
0.0 0.5 1.0 1.5 2.0 2.5 3.0 3.5
Shepard plot
Observed Dissimilarity
Ordination Distance
Non-metric fit, R
2 = 0.994
Linear fit, R
2 = 0.977
-1.5 -1.0 -0.5
0.0
0.5
1.0
-1.5 -1.0 -0.5
0.0
0.5
1.0
Goodness of fit
NMDS1
NMDS2
1
2 3
4
5
6
7
9
10
11
12
13
14
15
16
17
18 19
20
21
22
23
24
25
26
27 28
29
30
Cogo
Satr
Phph Babl
Thth
Teso
Chna
Pato
Lele
Sqce
Baba Albi
Gogo
Eslu
Pefl
Rham
Legi Scer
Cyca
Titi
Abbr
Icme
Gyce
Ruru
Blbj
Alal
Anan
Fig. 5.13 Shepard and goodness of fit diagrams of the NMDS result presented in Fig. 5.12. Poorly
fitted sites have larger bubbles
5.6 Nonmetric Multidimensional Scaling (NMDS)
195
If one must use a dissimilarity matrix with missing values, NMDS can be
computed with the function isoMDS(). An initial configuration must be provided
in the form of a matrix positioning the sites (argument y) in the number of
dimensions specified for the analysis (argument k). By default isoMDS() computes this initial configuration by PCoA, using function cmdscale(). To reduce
the risk of reaching a local minimum, we suggest to use the function bestnmds()
of the package labdsv. This function, which is a wrapper for isoMDS(),
computes the analysis a user-specified number of times (argument itr) with
internally produced random initial configurations. The solution with the smallest
stress value is retained by the function.
A useful way to assess the appropriateness of an NMDS result is to compare, in a
Shepard diagram, the dissimilarities among objects in the ordination plot with the
original dissimilarities. In addition, the goodness-of-fit of the ordination can be
measured as the R
2 of either a linear or a non-linear regression of the NMDS
distances on the original dissimilarities. All this is possible in R using vegan’s
functions stressplot() and goodness()(Fig. 5.13):
# Shepard plot and goodness of fit
par(mfrow = c(1, 2))
stressplot(spe.nmds, main = "Shepard plot")
gof <- goodness(spe.nmds)
plot(spe.nmds, type = "t", main = "Goodness of fit")
points(spe.nmds, display = "sites", cex = gof * 300)
0.2
0.4
0.6
0.8
1.0
0.0 0.5 1.0 1.5 2.0 2.5 3.0 3.5
Shepard plot
Observed Dissimilarity
Ordination Distance
Non-metric fit, R
2 = 0.994
Linear fit, R
2 = 0.977
-1.5 -1.0 -0.5
0.0
0.5
1.0
-1.5 -1.0 -0.5
0.0
0.5
1.0
Goodness of fit
NMDS1
NMDS2
1
2 3
4
5
6
7
9
10
11
12
13
14
15
16
17
18 19
20
21
22
23
24
25
26
27 28
29
30
Cogo
Satr
Phph Babl
Thth
Teso
Chna
Pato
Lele
Sqce
Baba Albi
Gogo
Eslu
Pefl
Rham
Legi Scer
Cyca
Titi
Abbr
Icme
Gyce
Ruru
Blbj
Alal
Anan
Fig. 5.13 Shepard and goodness of fit diagrams of the NMDS result presented in Fig. 5.12. Poorly
fitted sites have larger bubbles
5.6 Nonmetric Multidimensional Scaling (NMDS)
195