

Hints For projection of species data onto a PCoA plot, it is important to use the species
data with the same transformation (if any) as the one used to compute the
dissimilarity matrix. The standardization proposed here as an alternative may
help in better visualizing the variables if they have very different variances.
The argument dir.axis1 = -1 reverses axis 1 to make the result directly
comparable with the PCA result in Fig. 5.4, scaling 1. Remember that the signs of
ordination axes are arbitrary.
How does this result compare with that of the PCA?
If one wishes to plot only a subset of the variables, one can provide a reduced data
table as the second argument to the biplot.pcoa() function. For instance, in the
second graph above, one could limit the plot to the four species that gave their names
to Verneaux’s zones (see Sect. 1.5.1):
# Third biplot: standardized Hellinger -transformed species data;
# only four species in the plot (figure not shown in the book)
biplot.pcoa(spe.h.pcoa, spe.h[, c(2, 5, 11, 21)], dir.axis1 = -1)
abline(h = 0, lty = 3)
abline(v = 0, lty = 3)
-0.5
0.0
0.5
-0.5
0.0
0.5
Axis.1
Axis.2
1
2
3
4
5
6
7
9
10
11
12
13
14
15
16
17
18
19
20
21
22
23
24
25
26
27
28
29
30
-0.4
-0.2
0.0
0.2
0.4
-0.4
-0.2
0.0
0.2
0.4
Cogo
Satr
Phph
Babl
Thth
Teso
Chna
Pato
Lele
Sqce
Baba
Albi
Gogo
Eslu
Pefl
Rham
Legi
Scer
Cyca
Titi
Abbr
Icme
Gyce
Ruru
Blbj
Alal
Anan
PCoA biplot
Response variables projected
as in PCA with scaling 1
a
-0.5
0.0
0.5
-0.5
0.0
0.5
Axis.1
Axis.2
1
2
3
4
5
6
7
9
10
11
12
13
14
15
16
17
18
19
20
21
22
23
24
25
26
27
28
29
30
-3
-2
-1
0
1
2
-3
-2
-1
0
1
2
Cogo
Satr
Phph
Babl
Thth
Teso
Chna
Pato
Lele
Sqce
Baba
Albi
Gogo
Eslu
Pefl
Rham
Legi
Scer
Cyca
Titi
Abbr
Icme
Gyce
Ruru
Blbj
Alal
Anan
PCoA biplot
Response variables projected
as in PCA with scaling 1
b
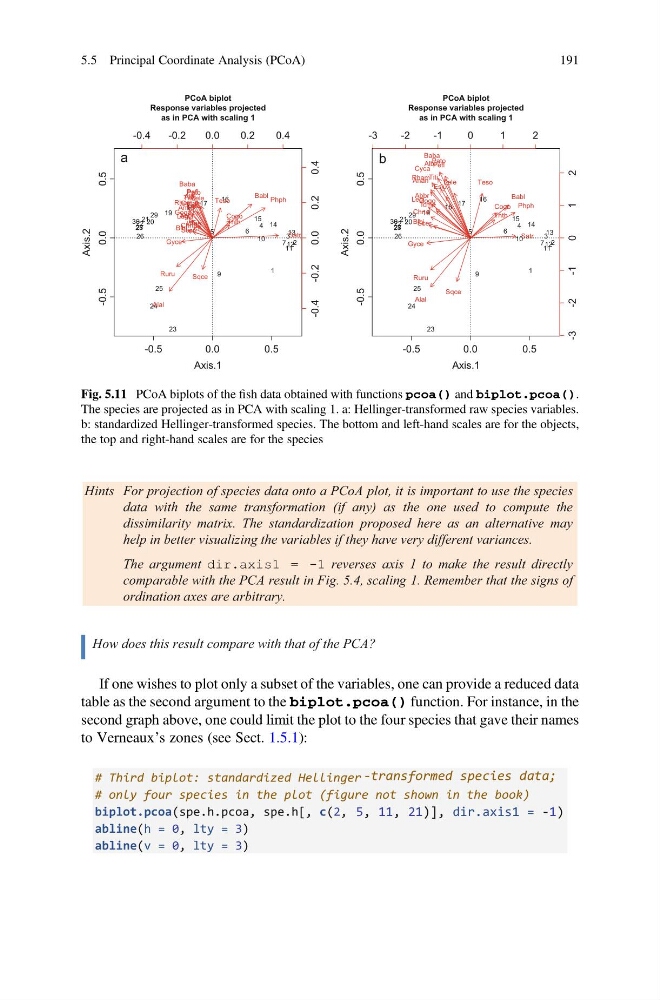
Fig. 5.11 PCoA biplots of the fish data obtained with functions pcoa() and biplot.pcoa().
The species are projected as in PCA with scaling 1. a: Hellinger-transformed raw species variables.
b: standardized Hellinger-transformed species. The bottom and left-hand scales are for the objects,
the top and right-hand scales are for the species
5.5 Principal Coordinate Analysis (PCoA)
191
data with the same transformation (if any) as the one used to compute the
dissimilarity matrix. The standardization proposed here as an alternative may
help in better visualizing the variables if they have very different variances.
The argument dir.axis1 = -1 reverses axis 1 to make the result directly
comparable with the PCA result in Fig. 5.4, scaling 1. Remember that the signs of
ordination axes are arbitrary.
How does this result compare with that of the PCA?
If one wishes to plot only a subset of the variables, one can provide a reduced data
table as the second argument to the biplot.pcoa() function. For instance, in the
second graph above, one could limit the plot to the four species that gave their names
to Verneaux’s zones (see Sect. 1.5.1):
# Third biplot: standardized Hellinger -transformed species data;
# only four species in the plot (figure not shown in the book)
biplot.pcoa(spe.h.pcoa, spe.h[, c(2, 5, 11, 21)], dir.axis1 = -1)
abline(h = 0, lty = 3)
abline(v = 0, lty = 3)
-0.5
0.0
0.5
-0.5
0.0
0.5
Axis.1
Axis.2
1
2
3
4
5
6
7
9
10
11
12
13
14
15
16
17
18
19
20
21
22
23
24
25
26
27
28
29
30
-0.4
-0.2
0.0
0.2
0.4
-0.4
-0.2
0.0
0.2
0.4
Cogo
Satr
Phph
Babl
Thth
Teso
Chna
Pato
Lele
Sqce
Baba
Albi
Gogo
Eslu
Pefl
Rham
Legi
Scer
Cyca
Titi
Abbr
Icme
Gyce
Ruru
Blbj
Alal
Anan
PCoA biplot
Response variables projected
as in PCA with scaling 1
a
-0.5
0.0
0.5
-0.5
0.0
0.5
Axis.1
Axis.2
1
2
3
4
5
6
7
9
10
11
12
13
14
15
16
17
18
19
20
21
22
23
24
25
26
27
28
29
30
-3
-2
-1
0
1
2
-3
-2
-1
0
1
2
Cogo
Satr
Phph
Babl
Thth
Teso
Chna
Pato
Lele
Sqce
Baba
Albi
Gogo
Eslu
Pefl
Rham
Legi
Scer
Cyca
Titi
Abbr
Icme
Gyce
Ruru
Blbj
Alal
Anan
PCoA biplot
Response variables projected
as in PCA with scaling 1
b
Fig. 5.11 PCoA biplots of the fish data obtained with functions pcoa() and biplot.pcoa().
The species are projected as in PCA with scaling 1. a: Hellinger-transformed raw species variables.
b: standardized Hellinger-transformed species. The bottom and left-hand scales are for the objects,
the top and right-hand scales are for the species
5.5 Principal Coordinate Analysis (PCoA)
191