

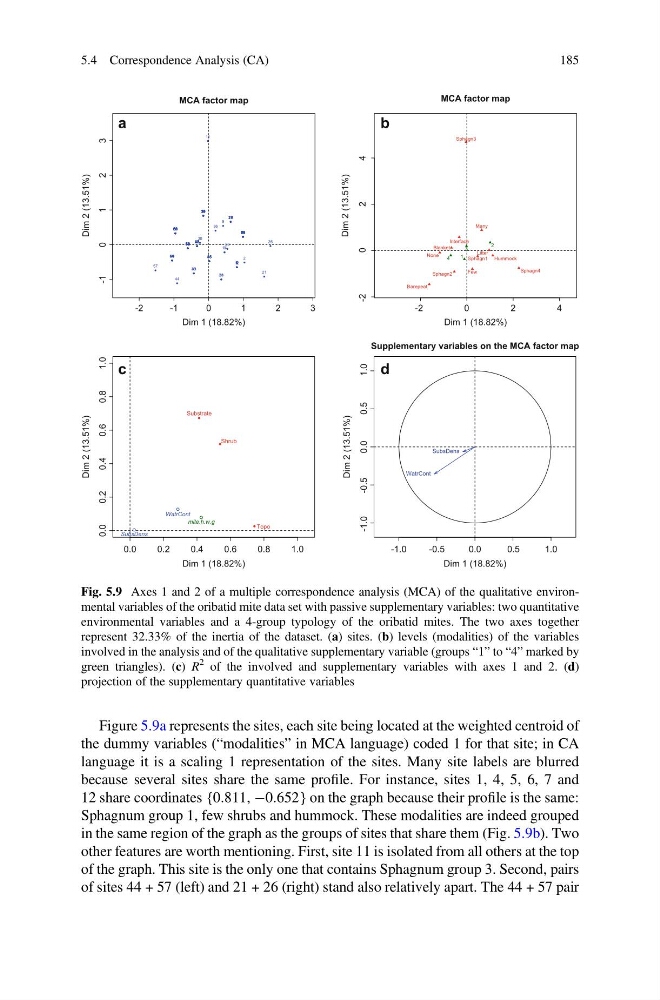
Figure 5.9a represents the sites, each site being located at the weighted centroid of
the dummy variables (“modalities” in MCA language) coded 1 for that site; in CA
language it is a scaling 1 representation of the sites. Many site labels are blurred
because several sites share the same profile. For instance, sites 1, 4, 5, 6, 7 and
12 share coordinates {0.811, À0.652} on the graph because their profile is the same:
Sphagnum group 1, few shrubs and hummock. These modalities are indeed grouped
in the same region of the graph as the groups of sites that share them (Fig. 5.9b). Two
other features are worth mentioning. First, site 11 is isolated from all others at the top
of the graph. This site is the only one that contains Sphagnum group 3. Second, pairs
of sites 44 + 57 (left) and 21 + 26 (right) stand also relatively apart. The 44 + 57 pair
-2
-1
0
1
2
3
-1
0
1
2
3
MCA factor map
Dim 1 (18.82%)
Dim 2 (13.51%)
1
2
3
4 5 6 7
8
9
10
11
12
13
14 15
16
17
18
19
20
21
22
23
24
25
26
27
28
29
30
31
32
33
34
35
36
37 38
39
40
41
42 43
44
45
46
47
48
49
50
51
52
53
54
55 56
57
58 59
60
61 62 63
64
65
66 67 68
69 70
-2
0
2
4
-2
0
2
4
MCA factor map
Dim 1 (18.82%)
Dim 2 (13.51%)
Barepeat
Interface
Litter
Sphagn1
Sphagn2
Sphagn3
Sphagn4
Few
Many
None
Blanket
Hummock
1
2
3
4
0.0
0.2
0.4
0.6
0.8
1.0
0.0
0.2
0.4
0.6
0.8
1.0
Dim 1 (18.82%)
Dim 2 (13.51%)
Substrate
Shrub
Topo
mite.h.w.g
SubsDens
WatrCont
-1.0
-0.5
0.0
0.5
1.0
-1.0
-0.5
0.0
0.5
1.0
Supplementary variables on the MCA factor map
Dim 1 (18.82%)
Dim 2 (13.51%)
SubsDens
WatrCont
a
b
c
d
Fig. 5.9 Axes 1 and 2 of a multiple correspondence analysis (MCA) of the qualitative environmental variables of the oribatid mite data set with passive supplementary variables: two quantitative
environmental variables and a 4-group typology of the oribatid mites. The two axes together
represent 32.33% of the inertia of the dataset. (a) sites. (b) levels (modalities) of the variables
involved in the analysis and of the qualitative supplementary variable (groups “1” to “4” marked by
green triangles). (c) R
2 of the involved and supplementary variables with axes 1 and 2. (d)
projection of the supplementary quantitative variables
5.4 Correspondence Analysis (CA)
185
the dummy variables (“modalities” in MCA language) coded 1 for that site; in CA
language it is a scaling 1 representation of the sites. Many site labels are blurred
because several sites share the same profile. For instance, sites 1, 4, 5, 6, 7 and
12 share coordinates {0.811, À0.652} on the graph because their profile is the same:
Sphagnum group 1, few shrubs and hummock. These modalities are indeed grouped
in the same region of the graph as the groups of sites that share them (Fig. 5.9b). Two
other features are worth mentioning. First, site 11 is isolated from all others at the top
of the graph. This site is the only one that contains Sphagnum group 3. Second, pairs
of sites 44 + 57 (left) and 21 + 26 (right) stand also relatively apart. The 44 + 57 pair
-2
-1
0
1
2
3
-1
0
1
2
3
MCA factor map
Dim 1 (18.82%)
Dim 2 (13.51%)
1
2
3
4 5 6 7
8
9
10
11
12
13
14 15
16
17
18
19
20
21
22
23
24
25
26
27
28
29
30
31
32
33
34
35
36
37 38
39
40
41
42 43
44
45
46
47
48
49
50
51
52
53
54
55 56
57
58 59
60
61 62 63
64
65
66 67 68
69 70
-2
0
2
4
-2
0
2
4
MCA factor map
Dim 1 (18.82%)
Dim 2 (13.51%)
Barepeat
Interface
Litter
Sphagn1
Sphagn2
Sphagn3
Sphagn4
Few
Many
None
Blanket
Hummock
1
2
3
4
0.0
0.2
0.4
0.6
0.8
1.0
0.0
0.2
0.4
0.6
0.8
1.0
Dim 1 (18.82%)
Dim 2 (13.51%)
Substrate
Shrub
Topo
mite.h.w.g
SubsDens
WatrCont
-1.0
-0.5
0.0
0.5
1.0
-1.0
-0.5
0.0
0.5
1.0
Supplementary variables on the MCA factor map
Dim 1 (18.82%)
Dim 2 (13.51%)
SubsDens
WatrCont
a
b
c
d
Fig. 5.9 Axes 1 and 2 of a multiple correspondence analysis (MCA) of the qualitative environmental variables of the oribatid mite data set with passive supplementary variables: two quantitative
environmental variables and a 4-group typology of the oribatid mites. The two axes together
represent 32.33% of the inertia of the dataset. (a) sites. (b) levels (modalities) of the variables
involved in the analysis and of the qualitative supplementary variable (groups “1” to “4” marked by
green triangles). (c) R
2 of the involved and supplementary variables with axes 1 and 2. (d)
projection of the supplementary quantitative variables
5.4 Correspondence Analysis (CA)
185