

The function displays some results on-screen during execution. These are
presented in a form close to canonical ordination results (see Chap. 6), because the
function actually runs a redundancy analysis on the species data, explained by the
variables retained by the MRT analysis, and recoded following the threshold values
of the tree nodes. Among the results, let us mention the R
2
, which is the
one-complement of the tree RE. In our example, Fig. 4.27 gives an error of 0.37
for the tree; therefore R
2 is equal to 0.63.
The summary of the result object provides information about the contribution of
each node to the explained variance (“Complexity”). The sum of these values gives
the overall R
2 . Furthermore, it identifies “discriminant” species at each node,
selecting the species that contribute most to the explained variance (down to a
minimum arbitrarily set by the user with the argument percent). The mean
(transformed) abundances are given for both branches of the nodes, so one can see
the branch for which the species are discriminant. For instance, our example analysis
shows species Satr, Phph and Babl for the left branch (higher altitude), and
Alal for the right. The summary lists the sites present in each leaf. The result object
itself contains the complete results from which the summary is drawn.
4.12.4 Combining MRT and IndVal
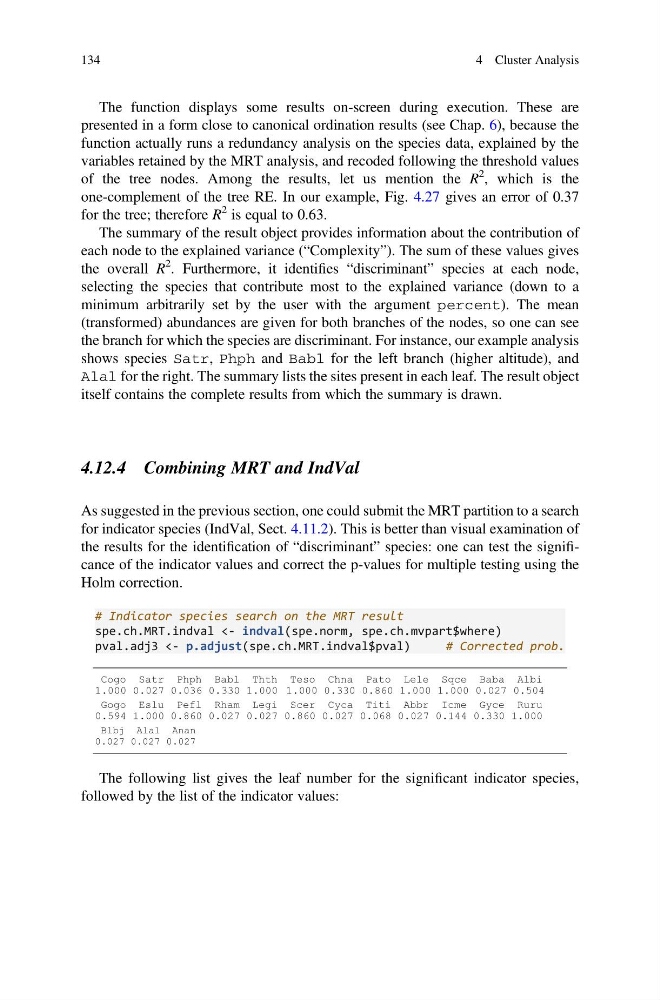
As suggested in the previous section, one could submit the MRT partition to a search
for indicator species (IndVal, Sect. 4.11.2). This is better than visual examination of
the results for the identification of “discriminant” species: one can test the significance of the indicator values and correct the p-values for multiple testing using the
Holm correction.
# Indicator species search on the MRT result
spe.ch.MRT.indval <- indval(spe.norm, spe.ch.mvpart$where)
pval.adj3 <- p.adjust(spe.ch.MRT.indval$pval)
# Corrected prob.
Cogo Satr Phph Babl Thth Teso Chna Pato Lele Sqce Baba Albi
1.000 0.027 0.036 0.330 1.000 1.000 0.330 0.860 1.000 1.000 0.027 0.504
Gogo Eslu Pefl Rham Legi Scer Cyca Titi Abbr Icme Gyce Ruru
0.594 1.000 0.860 0.027 0.027 0.860 0.027 0.068 0.027 0.144 0.330 1.000
Blbj Alal Anan
0.027 0.027 0.027
The following list gives the leaf number for the significant indicator species,
followed by the list of the indicator values:
134
4 Cluster Analysis
presented in a form close to canonical ordination results (see Chap. 6), because the
function actually runs a redundancy analysis on the species data, explained by the
variables retained by the MRT analysis, and recoded following the threshold values
of the tree nodes. Among the results, let us mention the R
2
, which is the
one-complement of the tree RE. In our example, Fig. 4.27 gives an error of 0.37
for the tree; therefore R
2 is equal to 0.63.
The summary of the result object provides information about the contribution of
each node to the explained variance (“Complexity”). The sum of these values gives
the overall R
2 . Furthermore, it identifies “discriminant” species at each node,
selecting the species that contribute most to the explained variance (down to a
minimum arbitrarily set by the user with the argument percent). The mean
(transformed) abundances are given for both branches of the nodes, so one can see
the branch for which the species are discriminant. For instance, our example analysis
shows species Satr, Phph and Babl for the left branch (higher altitude), and
Alal for the right. The summary lists the sites present in each leaf. The result object
itself contains the complete results from which the summary is drawn.
4.12.4 Combining MRT and IndVal
As suggested in the previous section, one could submit the MRT partition to a search
for indicator species (IndVal, Sect. 4.11.2). This is better than visual examination of
the results for the identification of “discriminant” species: one can test the significance of the indicator values and correct the p-values for multiple testing using the
Holm correction.
# Indicator species search on the MRT result
spe.ch.MRT.indval <- indval(spe.norm, spe.ch.mvpart$where)
pval.adj3 <- p.adjust(spe.ch.MRT.indval$pval)
# Corrected prob.
Cogo Satr Phph Babl Thth Teso Chna Pato Lele Sqce Baba Albi
1.000 0.027 0.036 0.330 1.000 1.000 0.330 0.860 1.000 1.000 0.027 0.504
Gogo Eslu Pefl Rham Legi Scer Cyca Titi Abbr Icme Gyce Ruru
0.594 1.000 0.860 0.027 0.027 0.860 0.027 0.068 0.027 0.144 0.330 1.000
Blbj Alal Anan
0.027 0.027 0.027
The following list gives the leaf number for the significant indicator species,
followed by the list of the indicator values:
134
4 Cluster Analysis