

# Heat map of the dissimilarity matrix ordered with the dendrogram
heatmap(
as.matrix(spe.ch),
Rowv = dend,
symm = TRUE,
margin = c(3, 3)
)
Hint Note that the hclust object has been converted to an object of class
dendrogram. This allows many advanced graphical manipulations of tree-like
structures. See the documentation file of the as.dendrogram() function,
where examples are given.
30
29
28
27
26
22
21
20
25
24
23
9
5
19
18
17
16
15
10
6
4
7
3
2
12
11
13
14
1
1
14
13
11
12
2
3
7
4
6
10
15
16
17
18
19
5
9
23
24
25
20
21
22
26
27
28
29
30
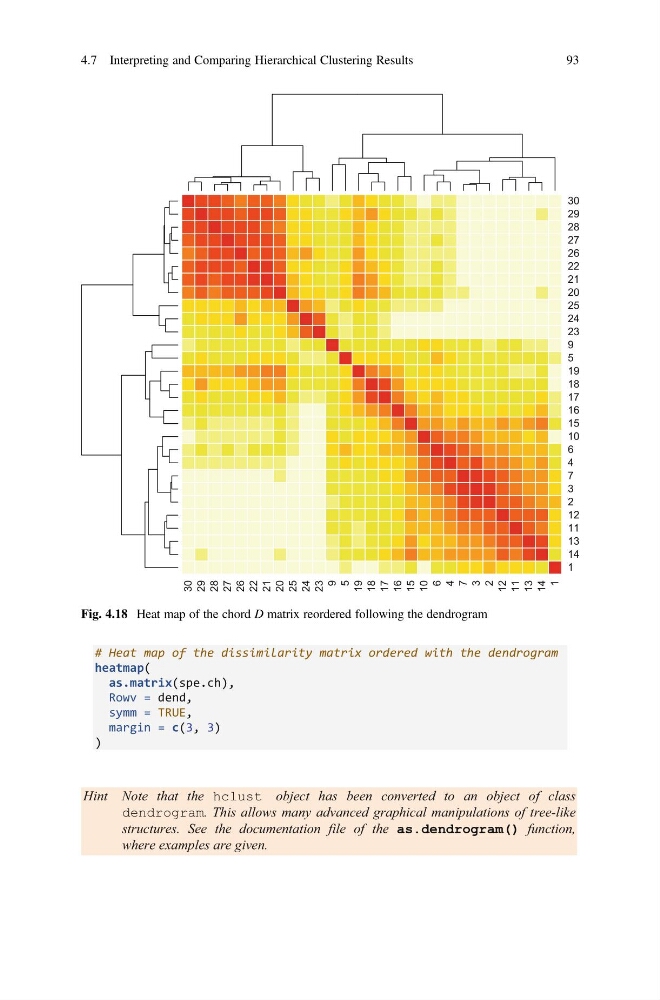
Fig. 4.18 Heat map of the chord D matrix reordered following the dendrogram
4.7 Interpreting and Comparing Hierarchical Clustering Results
93
heatmap(
as.matrix(spe.ch),
Rowv = dend,
symm = TRUE,
margin = c(3, 3)
)
Hint Note that the hclust object has been converted to an object of class
dendrogram. This allows many advanced graphical manipulations of tree-like
structures. See the documentation file of the as.dendrogram() function,
where examples are given.
30
29
28
27
26
22
21
20
25
24
23
9
5
19
18
17
16
15
10
6
4
7
3
2
12
11
13
14
1
1
14
13
11
12
2
3
7
4
6
10
15
16
17
18
19
5
9
23
24
25
20
21
22
26
27
28
29
30
Fig. 4.18 Heat map of the chord D matrix reordered following the dendrogram
4.7 Interpreting and Comparing Hierarchical Clustering Results
93