

# Convert the "hclust" object into a "dendrogram" object
dend <- as.dendrogram(spe.chwo)
# Plot the dendrogram with coloured branches
dend %>% set("branches_k_color", k = k) %>% plot
# Use standard colours for clusters
clusters <- cutree(dend, k)[order.dendrogram(dend)]
dend %>%
set("branches_k_color", k = k, value = unique(clusters) + 1) %>%
plot
# Add a coloured bar
colored_bars(clusters + 1,
y_shift = -0.5,
rowLabels = paste(k, "clusters"))
Hint Note the non-conventional syntax used by several recent packages, including
dendextend, based on a chaining of instructions separated by the operator
%>%.
4.7.3.9 Spatial Plot of the Clustering Result
The following code allows us to plot the clusters on a map representing the river.
This is a very useful way of representing results for spatially explicit data (Fig. 4.17).
0.0
0.5
1.0
1.5
2.0
2.5
3.0
3.5
30
29
28
27
26
22
21
20
25
24
23
9
5
19
18
17
16
15
10
6
4
7
3
2
12
11
13
14
1
4 clusters
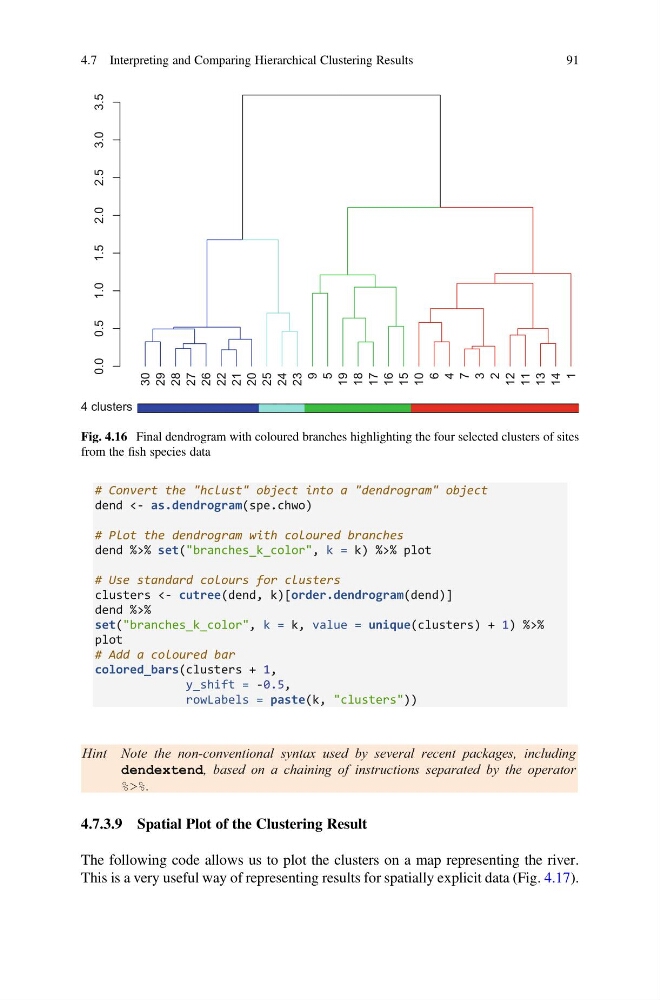
Fig. 4.16 Final dendrogram with coloured branches highlighting the four selected clusters of sites
from the fish species data
4.7 Interpreting and Comparing Hierarchical Clustering Results
91
dend <- as.dendrogram(spe.chwo)
# Plot the dendrogram with coloured branches
dend %>% set("branches_k_color", k = k) %>% plot
# Use standard colours for clusters
clusters <- cutree(dend, k)[order.dendrogram(dend)]
dend %>%
set("branches_k_color", k = k, value = unique(clusters) + 1) %>%
plot
# Add a coloured bar
colored_bars(clusters + 1,
y_shift = -0.5,
rowLabels = paste(k, "clusters"))
Hint Note the non-conventional syntax used by several recent packages, including
dendextend, based on a chaining of instructions separated by the operator
%>%.
4.7.3.9 Spatial Plot of the Clustering Result
The following code allows us to plot the clusters on a map representing the river.
This is a very useful way of representing results for spatially explicit data (Fig. 4.17).
0.0
0.5
1.0
1.5
2.0
2.5
3.0
3.5
30
29
28
27
26
22
21
20
25
24
23
9
5
19
18
17
16
15
10
6
4
7
3
2
12
11
13
14
1
4 clusters
Fig. 4.16 Final dendrogram with coloured branches highlighting the four selected clusters of sites
from the fish species data
4.7 Interpreting and Comparing Hierarchical Clustering Results
91