

Clusters 1 and 3 are the most coherent, while cluster 2 contains misclassified
objects.
4.7.3.8 Final Dendrogram with Graphical Options
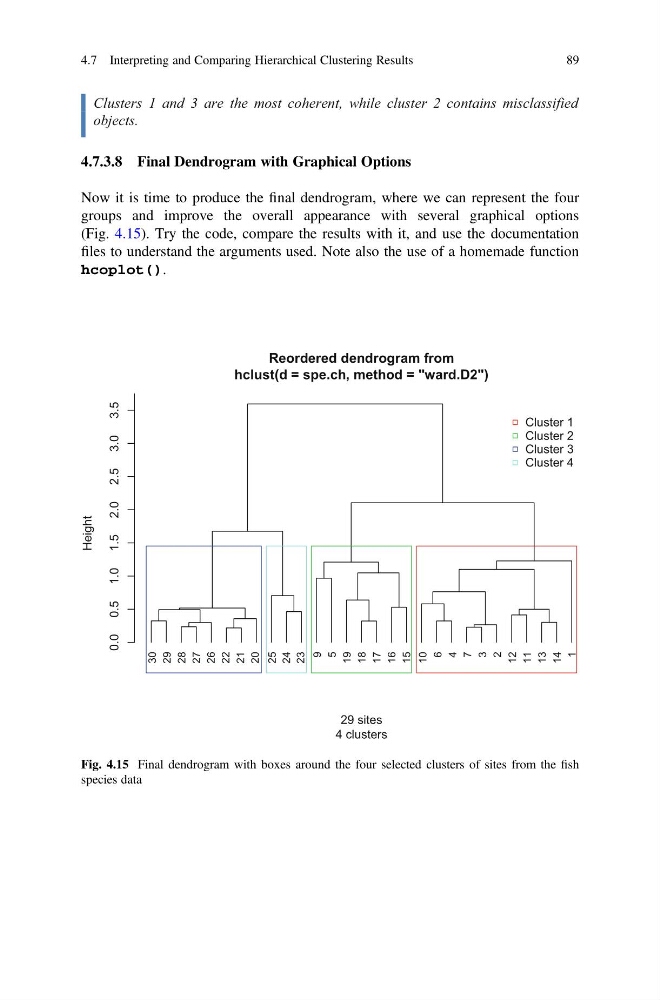
Now it is time to produce the final dendrogram, where we can represent the four
groups and improve the overall appearance with several graphical options
(Fig. 4.15). Try the code, compare the results with it, and use the documentation
files to understand the arguments used. Note also the use of a homemade function
hcoplot().
30
29
28
27
26
22
21
20
25
24
23
9
5
19
18
17
16
15
10
6
4
7
3
2
12
11
13
14
1
0.0 0.5 1.0 1.5 2.0 2.5 3.0 3.5
Reordered dendrogram from
hclust(d = spe.ch, method = "ward.D2")
29 sites
4 clusters
Height
Cluster 1
Cluster 2
Cluster 3
Cluster 4
Fig. 4.15 Final dendrogram with boxes around the four selected clusters of sites from the fish
species data
4.7 Interpreting and Comparing Hierarchical Clustering Results
89
objects.
4.7.3.8 Final Dendrogram with Graphical Options
Now it is time to produce the final dendrogram, where we can represent the four
groups and improve the overall appearance with several graphical options
(Fig. 4.15). Try the code, compare the results with it, and use the documentation
files to understand the arguments used. Note also the use of a homemade function
hcoplot().
30
29
28
27
26
22
21
20
25
24
23
9
5
19
18
17
16
15
10
6
4
7
3
2
12
11
13
14
1
0.0 0.5 1.0 1.5 2.0 2.5 3.0 3.5
Reordered dendrogram from
hclust(d = spe.ch, method = "ward.D2")
29 sites
4 clusters
Height
Cluster 1
Cluster 2
Cluster 3
Cluster 4
Fig. 4.15 Final dendrogram with boxes around the four selected clusters of sites from the fish
species data
4.7 Interpreting and Comparing Hierarchical Clustering Results
89