

The Lagoon Region and Estuary Ecosystem of Cananeia, Brazil
121
oc
25
24
23
22
21
20
19
18
17 J
300
250
200
150
100
50
A
~~::oa~
FMAMJJASOND
c
1956-1994
~~or.~~~~~
J F M A M J J A S O N D
25
24
23
22
21
20
19 J
E
1956-1994
~Ot"Jllll~
F M A M J J A S 0 N 0
cal/cm2/day
400
8
350
300
250
200
150
%
J F M A M J J A S O N D
0
7o r--------------------------,
60
o--O·-o
F
o--o
\
I
\
1956-1960
/
o,
· - ·
,o
\ ...... ·--......- "·'
;o' ' o--o--o, ,o\
1 .
'o--o"
• \
- · - • • - • POLAR AIR MASS
· -
50
40
30
o-- -oTROPICAL AIR MASS
JFMAMJJASONOJ
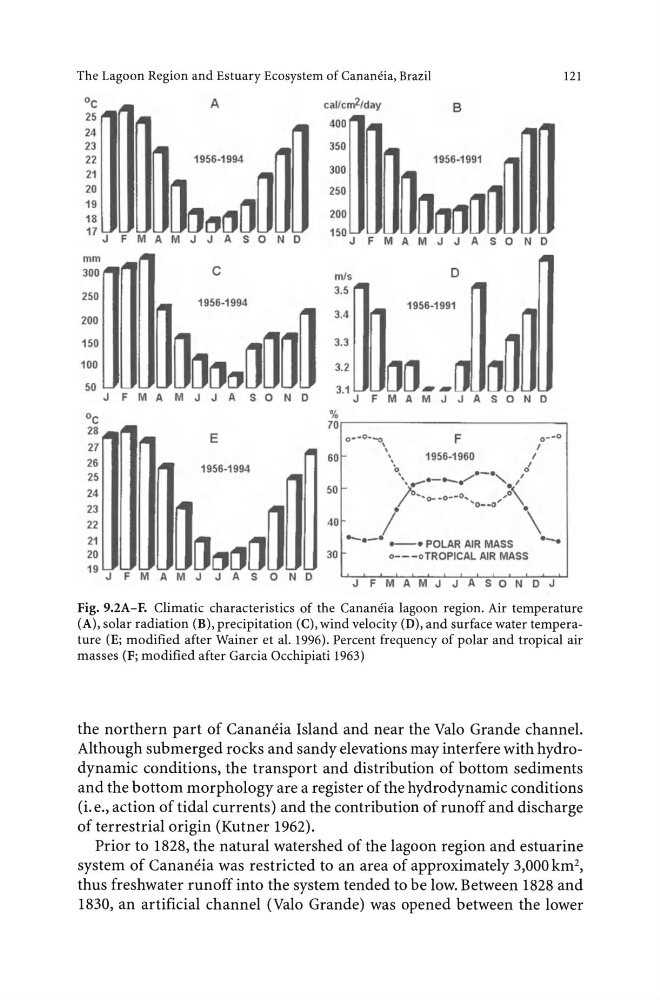
Fig. 9.2A-F. Climatic characteristics of the Cananeia lagoon region. Air temperature
(A), solar radiation (B), precipitation (C), wind velocity (D), and surface water temperature (E; modified after Wainer eta!. 1996). Percent frequency of polar and tropical air
masses (F; modified after Garcia Occhipiati 1963)
the northern part of Cananeia Island and near the Valo Grande channel.
Although submerged rocks and sandy elevations may interfere with hydrodynamic conditions, the transport and distribution of bottom sediments
and the bottom morphology are a register of the hydrodynamic conditions
(i.e., action of tidal currents) and the contribution of runoff and discharge
of terrestrial origin (Kutner 1962).
Prior to 1828, the natural watershed of the lagoon region and estuarine
system of Cananeia was restricted to an area of approximately 3,000km 2 ,
thus freshwater runoff into the system tended to be low. Between 1828 and
1830, an artificial channel (Valo Grande) was opened between the lower
121
oc
25
24
23
22
21
20
19
18
17 J
300
250
200
150
100
50
A
~~::oa~
FMAMJJASOND
c
1956-1994
~~or.~~~~~
J F M A M J J A S O N D
25
24
23
22
21
20
19 J
E
1956-1994
~Ot"Jllll~
F M A M J J A S 0 N 0
cal/cm2/day
400
8
350
300
250
200
150
%
J F M A M J J A S O N D
0
7o r--------------------------,
60
o--O·-o
F
o--o
\
I
\
1956-1960
/
o,
· - ·
,o
\ ...... ·--......- "·'
;o' ' o--o--o, ,o\
1 .
'o--o"
• \
- · - • • - • POLAR AIR MASS
· -
50
40
30
o-- -oTROPICAL AIR MASS
JFMAMJJASONOJ
Fig. 9.2A-F. Climatic characteristics of the Cananeia lagoon region. Air temperature
(A), solar radiation (B), precipitation (C), wind velocity (D), and surface water temperature (E; modified after Wainer eta!. 1996). Percent frequency of polar and tropical air
masses (F; modified after Garcia Occhipiati 1963)
the northern part of Cananeia Island and near the Valo Grande channel.
Although submerged rocks and sandy elevations may interfere with hydrodynamic conditions, the transport and distribution of bottom sediments
and the bottom morphology are a register of the hydrodynamic conditions
(i.e., action of tidal currents) and the contribution of runoff and discharge
of terrestrial origin (Kutner 1962).
Prior to 1828, the natural watershed of the lagoon region and estuarine
system of Cananeia was restricted to an area of approximately 3,000km 2 ,
thus freshwater runoff into the system tended to be low. Between 1828 and
1830, an artificial channel (Valo Grande) was opened between the lower