

220
P.L. Meserve
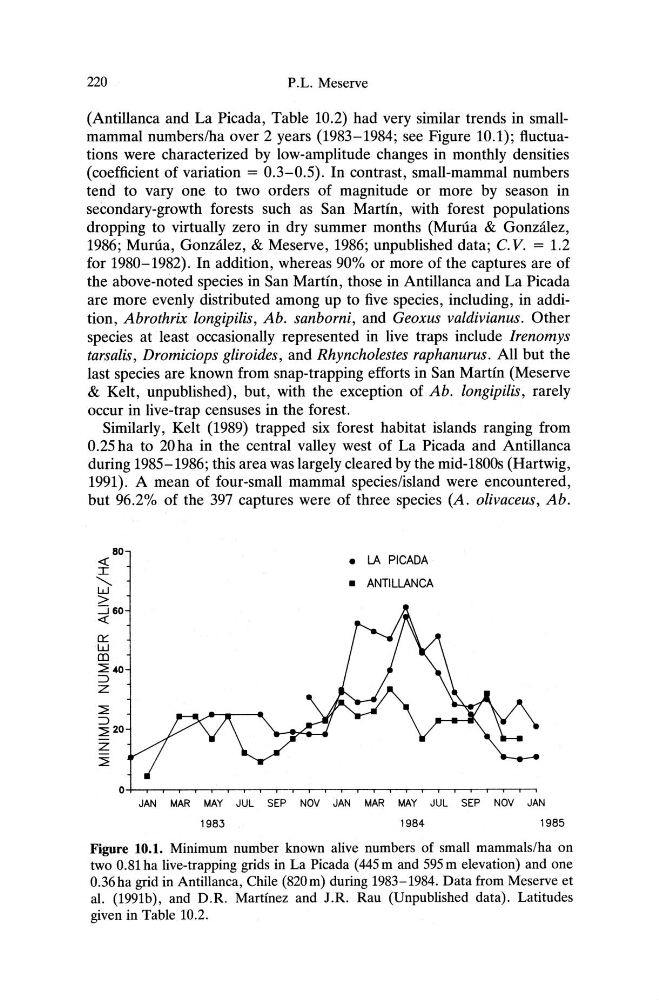
(Antillanca and La Picada, Table 10.2) had very similar trends in smallmammal numbers/ha over 2 years (1983-1984; see Figure 10.1); fluctuations were characterized by low-amplitude changes in monthly densities
(coefficient of variation = 0.3-0.5). In contrast, small-mammal numbers
tend to vary one to two orders of magnitude or more by season in
secondary-growth forests such as San Martin, with forest populations
dropping to virtually zero in dry summer months (Munia & Gonzalez,
1986; Munia, Gonzalez , & Meserve, 1986; unpublished data; C. V. = 1.2
for 1980-1982) . In addition , whereas 90% or more of the captures are of
the above-noted species in San Martin, those in Antillanca and La Picada
are more evenly distributed among up to five species, including, in addition, Abrothrix longipilis, Ab. sanborni, and Geoxus valdivianus. Other
species at least occasionally represented in live traps include Irenomys
tarsalis , Dromiciops gliroides, and Rhyncholestes raphanurus. All but the
last species are known from snap-trapping efforts in San Martin (Meserve
& Kelt, unpublished), but, with the exception of Ab. longipilis, rarely
occur in live-trap censuses in the forest.
Similarly, Kelt (1989) trapped six forest habitat islands ranging from
0.25 ha to 20ha in the central valley west of La Picada and Antillanca
during 1985-1986; this area was largely cleared by the mid-1800s (Hartwig,
1991). A mean of four-small mammal species/island were encountered,
but 96.2% of the 397 captures were of three species (A . olivaceus, Ab.
80
«
I
<,
W
>
::J 60
«
0:::
w
Q)
240
::>
z
2
::>
2 20
z
2
• LA PICADA
• ANTILLANCA
JAN MAR MAY JUL SEP NOV JAN MAR MAY JUL SEP NOV JAN
1983
1984
1985
Figure 10.1. Minimum number known alive numbers of small mammals/ha on
two 0:81 ha live-trapping grids in La Picada (445m and 595m elevation) and one
0.36ha grid in Antillanca , Chile (820m) during 1983-1984. Data from Meserve et
al. (1991b), and D .R. Martinez and l.R. Rau (Unpublished data) . Latitudes
given in Table 10.2.
P.L. Meserve
(Antillanca and La Picada, Table 10.2) had very similar trends in smallmammal numbers/ha over 2 years (1983-1984; see Figure 10.1); fluctuations were characterized by low-amplitude changes in monthly densities
(coefficient of variation = 0.3-0.5). In contrast, small-mammal numbers
tend to vary one to two orders of magnitude or more by season in
secondary-growth forests such as San Martin, with forest populations
dropping to virtually zero in dry summer months (Munia & Gonzalez,
1986; Munia, Gonzalez , & Meserve, 1986; unpublished data; C. V. = 1.2
for 1980-1982) . In addition , whereas 90% or more of the captures are of
the above-noted species in San Martin, those in Antillanca and La Picada
are more evenly distributed among up to five species, including, in addition, Abrothrix longipilis, Ab. sanborni, and Geoxus valdivianus. Other
species at least occasionally represented in live traps include Irenomys
tarsalis , Dromiciops gliroides, and Rhyncholestes raphanurus. All but the
last species are known from snap-trapping efforts in San Martin (Meserve
& Kelt, unpublished), but, with the exception of Ab. longipilis, rarely
occur in live-trap censuses in the forest.
Similarly, Kelt (1989) trapped six forest habitat islands ranging from
0.25 ha to 20ha in the central valley west of La Picada and Antillanca
during 1985-1986; this area was largely cleared by the mid-1800s (Hartwig,
1991). A mean of four-small mammal species/island were encountered,
but 96.2% of the 397 captures were of three species (A . olivaceus, Ab.
80
«
I
<,
W
>
::J 60
«
0:::
w
Q)
240
::>
z
2
::>
2 20
z
2
• LA PICADA
• ANTILLANCA
JAN MAR MAY JUL SEP NOV JAN MAR MAY JUL SEP NOV JAN
1983
1984
1985
Figure 10.1. Minimum number known alive numbers of small mammals/ha on
two 0:81 ha live-trapping grids in La Picada (445m and 595m elevation) and one
0.36ha grid in Antillanca , Chile (820m) during 1983-1984. Data from Meserve et
al. (1991b), and D .R. Martinez and l.R. Rau (Unpublished data) . Latitudes
given in Table 10.2.