

351
The global estimate of the soil organic carbon accumulation rate in SCEs
ranged from 22 to 844 Tg C year
−1
, with a mean value of 136 Tg C year
−1
, which
is comparable to previous reports (Nellemann et al. 2009; Pendleton et al. 2012).
Estuaries (mean, 81 Tg C year
−1
) were major contributors to the total accumulation rate in SCEs, as reported previously (Nellemann et al. 2009).
To the best of our knowledge, this work provides the first global estimate of CO 2
exchange rates in SCEs. The estimated rates ranged from −7984 to 6268 Tg C
year
−1
, with a mean of −1071 Tg C year
−1
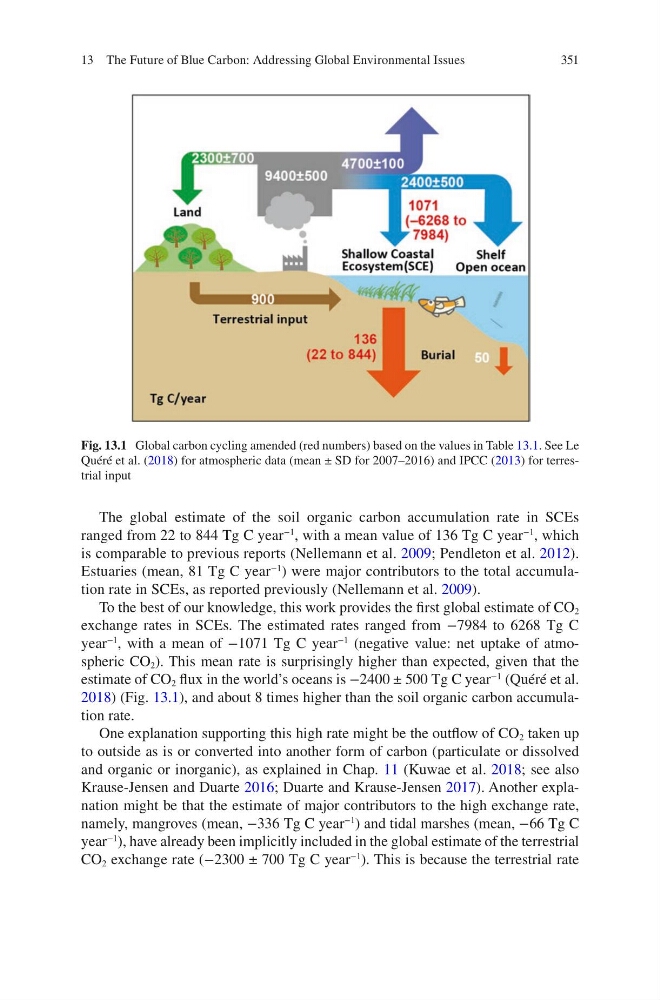
(negative value: net uptake of atmospheric CO 2 ). This mean rate is surprisingly higher than expected, given that the
estimate of CO 2 flux in the world’s oceans is −2400 ± 500 Tg C year
−1
(Quéré et al.
2018) (Fig. 13.1), and about 8 times higher than the soil organic carbon accumulation rate.
One explanation supporting this high rate might be the outflow of CO 2 taken up
to outside as is or converted into another form of carbon (particulate or dissolved
and organic or inorganic), as explained in Chap. 11 (Kuwae et al. 2018; see also
Krause-Jensen and Duarte 2016; Duarte and Krause-Jensen 2017). Another explanation might be that the estimate of major contributors to the high exchange rate,
namely, mangroves (mean, −336 Tg C year
−1
) and tidal marshes (mean, −66 Tg C
year
−1
), have already been implicitly included in the global estimate of the terrestrial
CO 2 exchange rate (−2300 ± 700 Tg C year
−1
). This is because the terrestrial rate
Fig. 13.1 Global carbon cycling amended (red numbers) based on the values in Table 13.1. See Le
Quéré et al. (2018) for atmospheric data (mean ± SD for 2007–2016) and IPCC (2013) for terrestrial input
13 The Future of Blue Carbon: Addressing Global Environmental Issues
The global estimate of the soil organic carbon accumulation rate in SCEs
ranged from 22 to 844 Tg C year
−1
, with a mean value of 136 Tg C year
−1
, which
is comparable to previous reports (Nellemann et al. 2009; Pendleton et al. 2012).
Estuaries (mean, 81 Tg C year
−1
) were major contributors to the total accumulation rate in SCEs, as reported previously (Nellemann et al. 2009).
To the best of our knowledge, this work provides the first global estimate of CO 2
exchange rates in SCEs. The estimated rates ranged from −7984 to 6268 Tg C
year
−1
, with a mean of −1071 Tg C year
−1
(negative value: net uptake of atmospheric CO 2 ). This mean rate is surprisingly higher than expected, given that the
estimate of CO 2 flux in the world’s oceans is −2400 ± 500 Tg C year
−1
(Quéré et al.
2018) (Fig. 13.1), and about 8 times higher than the soil organic carbon accumulation rate.
One explanation supporting this high rate might be the outflow of CO 2 taken up
to outside as is or converted into another form of carbon (particulate or dissolved
and organic or inorganic), as explained in Chap. 11 (Kuwae et al. 2018; see also
Krause-Jensen and Duarte 2016; Duarte and Krause-Jensen 2017). Another explanation might be that the estimate of major contributors to the high exchange rate,
namely, mangroves (mean, −336 Tg C year
−1
) and tidal marshes (mean, −66 Tg C
year
−1
), have already been implicitly included in the global estimate of the terrestrial
CO 2 exchange rate (−2300 ± 700 Tg C year
−1
). This is because the terrestrial rate
Fig. 13.1 Global carbon cycling amended (red numbers) based on the values in Table 13.1. See Le
Quéré et al. (2018) for atmospheric data (mean ± SD for 2007–2016) and IPCC (2013) for terrestrial input
13 The Future of Blue Carbon: Addressing Global Environmental Issues