

331
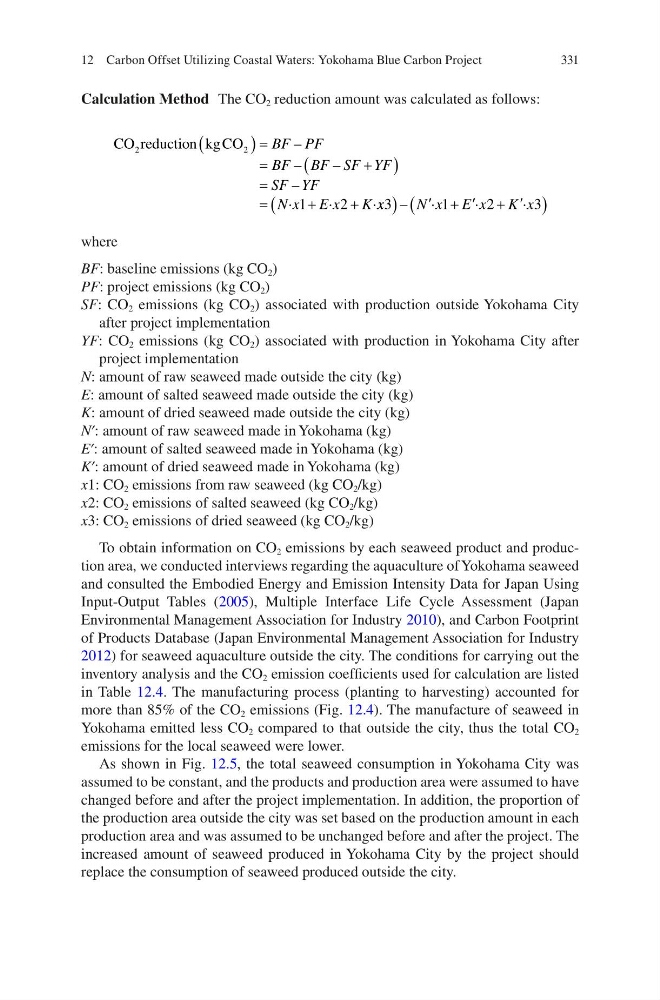
Calculation Method The CO 2 reduction amount was calculated as follows:
CO reduction kg CO
2
2
1
2
(
)=
=
+
(
)
=
=
+
+
BF PF
BF BF SF YF
SF YF
N x E x K
–
–
–
–
·
·
·x x
N x E x K x
3
1
2
3
(
)
+
+
(
)
¢
¢
¢
–
·
·
·
where
BF: baseline emissions (kg CO 2 )
PF: project emissions (kg CO 2 )
SF: CO 2 emissions (kg CO 2 ) associated with production outside Yokohama City
after project implementation
YF: CO 2 emissions (kg CO 2 ) associated with production in Yokohama City after
project implementation
N: amount of raw seaweed made outside the city (kg)
E: amount of salted seaweed made outside the city (kg)
K: amount of dried seaweed made outside the city (kg)
N′: amount of raw seaweed made in Yokohama (kg)
E′: amount of salted seaweed made in Yokohama (kg)
K′: amount of dried seaweed made in Yokohama (kg)
x1: CO 2 emissions from raw seaweed (kg CO 2 /kg)
x2: CO 2 emissions of salted seaweed (kg CO 2 /kg)
x3: CO 2 emissions of dried seaweed (kg CO 2 /kg)
To obtain information on CO 2 emissions by each seaweed product and production area, we conducted interviews regarding the aquaculture of Yokohama seaweed
and consulted the Embodied Energy and Emission Intensity Data for Japan Using
Input-Output Tables (2005), Multiple Interface Life Cycle Assessment (Japan
Environmental Management Association for Industry 2010), and Carbon Footprint
of Products Database (Japan Environmental Management Association for Industry
2012) for seaweed aquaculture outside the city. The conditions for carrying out the
inventory analysis and the CO 2 emission coefficients used for calculation are listed
in Table 12.4. The manufacturing process (planting to harvesting) accounted for
more than 85% of the CO 2 emissions (Fig. 12.4). The manufacture of seaweed in
Yokohama emitted less CO 2 compared to that outside the city, thus the total CO 2
emissions for the local seaweed were lower.
As shown in Fig. 12.5, the total seaweed consumption in Yokohama City was
assumed to be constant, and the products and production area were assumed to have
changed before and after the project implementation. In addition, the proportion of
the production area outside the city was set based on the production amount in each
production area and was assumed to be unchanged before and after the project. The
increased amount of seaweed produced in Yokohama City by the project should
replace the consumption of seaweed produced outside the city.
12 Carbon Offset Utilizing Coastal Waters: Yokohama Blue Carbon Project
Calculation Method The CO 2 reduction amount was calculated as follows:
CO reduction kg CO
2
2
1
2
(
)=
=
+
(
)
=
=
+
+
BF PF
BF BF SF YF
SF YF
N x E x K
–
–
–
–
·
·
·x x
N x E x K x
3
1
2
3
(
)
+
+
(
)
¢
¢
¢
–
·
·
·
where
BF: baseline emissions (kg CO 2 )
PF: project emissions (kg CO 2 )
SF: CO 2 emissions (kg CO 2 ) associated with production outside Yokohama City
after project implementation
YF: CO 2 emissions (kg CO 2 ) associated with production in Yokohama City after
project implementation
N: amount of raw seaweed made outside the city (kg)
E: amount of salted seaweed made outside the city (kg)
K: amount of dried seaweed made outside the city (kg)
N′: amount of raw seaweed made in Yokohama (kg)
E′: amount of salted seaweed made in Yokohama (kg)
K′: amount of dried seaweed made in Yokohama (kg)
x1: CO 2 emissions from raw seaweed (kg CO 2 /kg)
x2: CO 2 emissions of salted seaweed (kg CO 2 /kg)
x3: CO 2 emissions of dried seaweed (kg CO 2 /kg)
To obtain information on CO 2 emissions by each seaweed product and production area, we conducted interviews regarding the aquaculture of Yokohama seaweed
and consulted the Embodied Energy and Emission Intensity Data for Japan Using
Input-Output Tables (2005), Multiple Interface Life Cycle Assessment (Japan
Environmental Management Association for Industry 2010), and Carbon Footprint
of Products Database (Japan Environmental Management Association for Industry
2012) for seaweed aquaculture outside the city. The conditions for carrying out the
inventory analysis and the CO 2 emission coefficients used for calculation are listed
in Table 12.4. The manufacturing process (planting to harvesting) accounted for
more than 85% of the CO 2 emissions (Fig. 12.4). The manufacture of seaweed in
Yokohama emitted less CO 2 compared to that outside the city, thus the total CO 2
emissions for the local seaweed were lower.
As shown in Fig. 12.5, the total seaweed consumption in Yokohama City was
assumed to be constant, and the products and production area were assumed to have
changed before and after the project implementation. In addition, the proportion of
the production area outside the city was set based on the production amount in each
production area and was assumed to be unchanged before and after the project. The
increased amount of seaweed produced in Yokohama City by the project should
replace the consumption of seaweed produced outside the city.
12 Carbon Offset Utilizing Coastal Waters: Yokohama Blue Carbon Project