

257
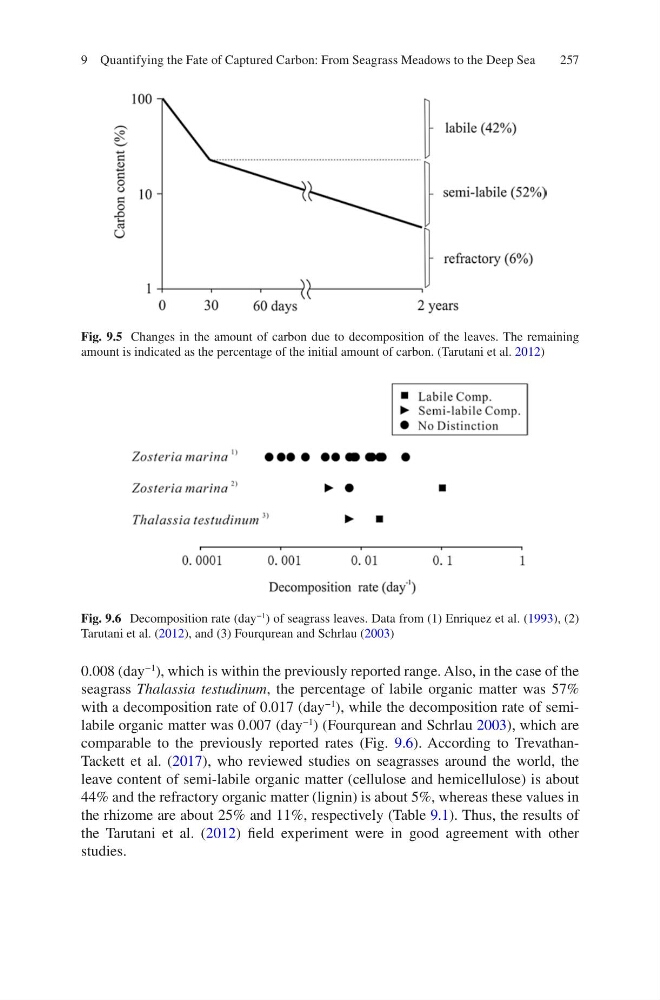
0.008 (day
−1
), which is within the previously reported range. Also, in the case of the
seagrass Thalassia testudinum, the percentage of labile organic matter was 57%
with a decomposition rate of 0.017 (day
−1
), while the decomposition rate of semilabile organic matter was 0.007 (day
−1
) (Fourqurean and Schrlau 2003), which are
comparable to the previously reported rates (Fig. 9.6). According to TrevathanTackett et al. (2017), who reviewed studies on seagrasses around the world, the
leave content of semi-labile organic matter (cellulose and hemicellulose) is about
44% and the refractory organic matter (lignin) is about 5%, whereas these values in
the rhizome are about 25% and 11%, respectively (Table 9.1). Thus, the results of
the Tarutani et al. (2012) field experiment were in good agreement with other
studies.
Fig. 9.5 Changes in the amount of carbon due to decomposition of the leaves. The remaining
amount is indicated as the percentage of the initial amount of carbon. (Tarutani et al. 2012)
Fig. 9.6 Decomposition rate (day
−1 ) of seagrass leaves. Data from (1) Enriquez et al. (1993), (2)
Tarutani et al. (2012), and (3) Fourqurean and Schrlau (2003)
9 Quantifying the Fate of Captured Carbon: From Seagrass Meadows to the Deep Sea
0.008 (day
−1
), which is within the previously reported range. Also, in the case of the
seagrass Thalassia testudinum, the percentage of labile organic matter was 57%
with a decomposition rate of 0.017 (day
−1
), while the decomposition rate of semilabile organic matter was 0.007 (day
−1
) (Fourqurean and Schrlau 2003), which are
comparable to the previously reported rates (Fig. 9.6). According to TrevathanTackett et al. (2017), who reviewed studies on seagrasses around the world, the
leave content of semi-labile organic matter (cellulose and hemicellulose) is about
44% and the refractory organic matter (lignin) is about 5%, whereas these values in
the rhizome are about 25% and 11%, respectively (Table 9.1). Thus, the results of
the Tarutani et al. (2012) field experiment were in good agreement with other
studies.
Fig. 9.5 Changes in the amount of carbon due to decomposition of the leaves. The remaining
amount is indicated as the percentage of the initial amount of carbon. (Tarutani et al. 2012)
Fig. 9.6 Decomposition rate (day
−1 ) of seagrass leaves. Data from (1) Enriquez et al. (1993), (2)
Tarutani et al. (2012), and (3) Fourqurean and Schrlau (2003)
9 Quantifying the Fate of Captured Carbon: From Seagrass Meadows to the Deep Sea