

199
7.3.2 Magnitude of Soil CO 2 Fluxes in Comparison
with Atmosphere-Biosphere CO 2 Exchange
First of all it is worth mentioning that the magnitudes of CO 2 fluxes from the soils are
substantially less than that observed for the atmosphere-biosphere fluxes as has
been shown in salt marsh ecosystems (Otani and Endo 2018). Moreover, the range of
fluxes (or in terms of standard deviation) is quite small compared to the atmospherebiosphere fluxes. Negative fluxes of CO 2 , i.e. towards the soil from atmosphere are
scarcely observed (Lovelock 2008; Leopold et al. 2013; Chen et al. 2014, 2016).
Most of the studies observed only effluxes of CO 2 from the soil; i.e. the soils only
emitted CO 2 ; however, in some instances where the authors witnessed algal mat cover
or biofilms in the study regions negative fluxes were observed [like Leopold et al.
(2013) in New Caledonia Mangroves; Chen et al. (2014) in Indonesian mangroves].
7.3.3 Sulphate Reducers
Alongi et al. (2005) observed that a major part of the organic carbon ending up in
the upper layer of pedosphere was oxidized by sulphate reducers followed by aerobic bacteria, denitrifiers, metal-reducing bacteria and methanogens. The magnitude
of fluxes observed in this study site was on the lower end compared to the other
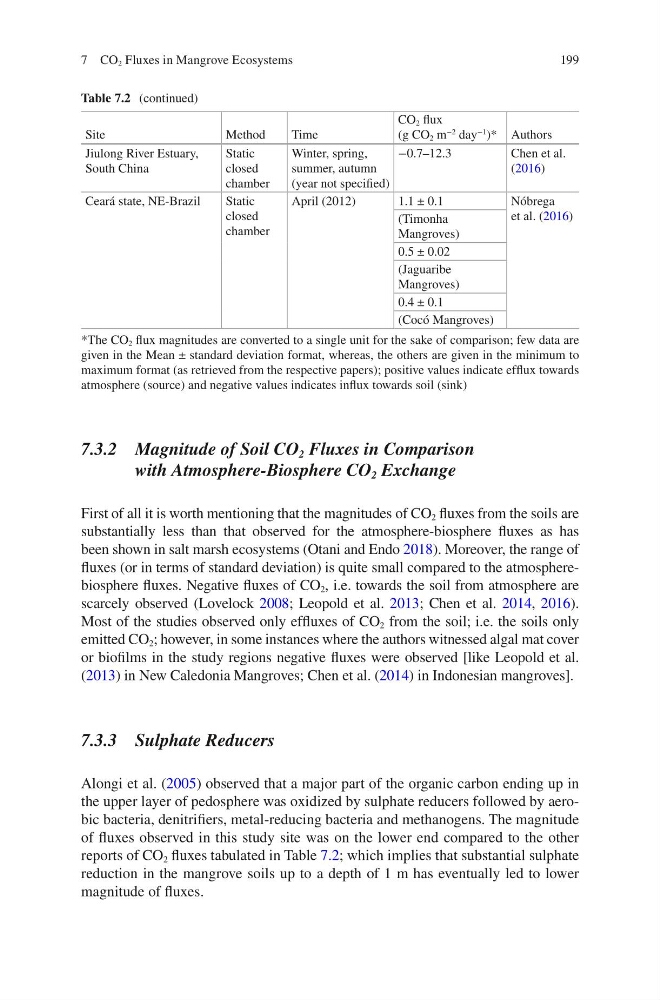
reports of CO 2 fluxes tabulated in Table 7.2; which implies that substantial sulphate
reduction in the mangrove soils up to a depth of 1 m has eventually led to lower
magnitude of fluxes.
Table 7.2 (continued)
Site
Method
Time
CO 2 flux
(g CO 2 m
−2 day
−1 )* Authors
Jiulong River Estuary,
South China
Static
closed
chamber
Winter, spring,
summer, autumn
(year not specified)
−0.7–12.3
Chen et al.
(2016)
Ceará state, NE-Brazil
Static
closed
chamber
April (2012)
1.1 ± 0.1
Nóbrega
et al. (2016)
(Timonha
Mangroves)
0.5 ± 0.02
(Jaguaribe
Mangroves)
0.4 ± 0.1
(Cocó Mangroves)
*The CO 2 flux magnitudes are converted to a single unit for the sake of comparison; few data are
given in the Mean ± standard deviation format, whereas, the others are given in the minimum to
maximum format (as retrieved from the respective papers); positive values indicate efflux towards
atmosphere (source) and negative values indicates influx towards soil (sink)
7 CO 2 Fluxes in Mangrove Ecosystems
7.3.2 Magnitude of Soil CO 2 Fluxes in Comparison
with Atmosphere-Biosphere CO 2 Exchange
First of all it is worth mentioning that the magnitudes of CO 2 fluxes from the soils are
substantially less than that observed for the atmosphere-biosphere fluxes as has
been shown in salt marsh ecosystems (Otani and Endo 2018). Moreover, the range of
fluxes (or in terms of standard deviation) is quite small compared to the atmospherebiosphere fluxes. Negative fluxes of CO 2 , i.e. towards the soil from atmosphere are
scarcely observed (Lovelock 2008; Leopold et al. 2013; Chen et al. 2014, 2016).
Most of the studies observed only effluxes of CO 2 from the soil; i.e. the soils only
emitted CO 2 ; however, in some instances where the authors witnessed algal mat cover
or biofilms in the study regions negative fluxes were observed [like Leopold et al.
(2013) in New Caledonia Mangroves; Chen et al. (2014) in Indonesian mangroves].
7.3.3 Sulphate Reducers
Alongi et al. (2005) observed that a major part of the organic carbon ending up in
the upper layer of pedosphere was oxidized by sulphate reducers followed by aerobic bacteria, denitrifiers, metal-reducing bacteria and methanogens. The magnitude
of fluxes observed in this study site was on the lower end compared to the other
reports of CO 2 fluxes tabulated in Table 7.2; which implies that substantial sulphate
reduction in the mangrove soils up to a depth of 1 m has eventually led to lower
magnitude of fluxes.
Table 7.2 (continued)
Site
Method
Time
CO 2 flux
(g CO 2 m
−2 day
−1 )* Authors
Jiulong River Estuary,
South China
Static
closed
chamber
Winter, spring,
summer, autumn
(year not specified)
−0.7–12.3
Chen et al.
(2016)
Ceará state, NE-Brazil
Static
closed
chamber
April (2012)
1.1 ± 0.1
Nóbrega
et al. (2016)
(Timonha
Mangroves)
0.5 ± 0.02
(Jaguaribe
Mangroves)
0.4 ± 0.1
(Cocó Mangroves)
*The CO 2 flux magnitudes are converted to a single unit for the sake of comparison; few data are
given in the Mean ± standard deviation format, whereas, the others are given in the minimum to
maximum format (as retrieved from the respective papers); positive values indicate efflux towards
atmosphere (source) and negative values indicates influx towards soil (sink)
7 CO 2 Fluxes in Mangrove Ecosystems