

198
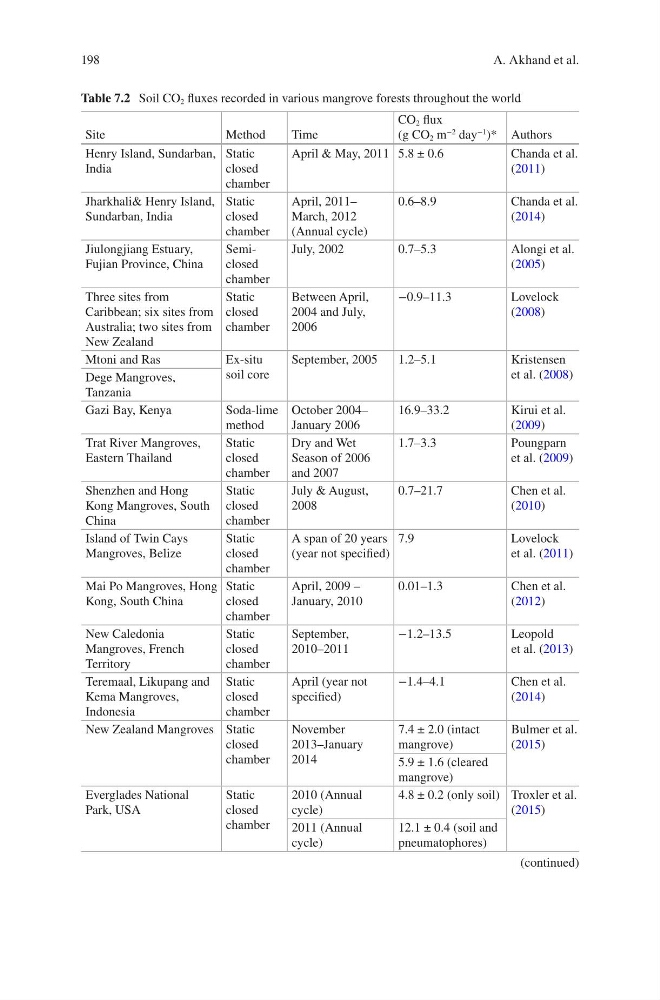
Table 7.2 Soil CO 2 fluxes recorded in various mangrove forests throughout the world
Site
Method
Time
CO 2 flux
(g CO 2 m
−2 day
−1 )* Authors
Henry Island, Sundarban,
India
Static
closed
chamber
April & May, 2011 5.8 ± 0.6
Chanda et al.
(2011)
Jharkhali& Henry Island,
Sundarban, India
Static
closed
chamber
April, 2011–
March, 2012
(Annual cycle)
0.6–8.9
Chanda et al.
(2014)
Jiulongjiang Estuary,
Fujian Province, China
Semiclosed
chamber
July, 2002
0.7–5.3
Alongi et al.
(2005)
Three sites from
Caribbean; six sites from
Australia; two sites from
New Zealand
Static
closed
chamber
Between April,
2004 and July,
2006
−0.9–11.3
Lovelock
(2008)
Mtoni and Ras
Ex-situ
soil core
September, 2005
1.2–5.1
Kristensen
et al. (2008)
Dege Mangroves,
Tanzania
Gazi Bay, Kenya
Soda-lime
method
October 2004–
January 2006
16.9–33.2
Kirui et al.
(2009)
Trat River Mangroves,
Eastern Thailand
Static
closed
chamber
Dry and Wet
Season of 2006
and 2007
1.7–3.3
Poungparn
et al. (2009)
Shenzhen and Hong
Kong Mangroves, South
China
Static
closed
chamber
July & August,
2008
0.7–21.7
Chen et al.
(2010)
Island of Twin Cays
Mangroves, Belize
Static
closed
chamber
A span of 20 years
(year not specified)
7.9
Lovelock
et al. (2011)
Mai Po Mangroves, Hong
Kong, South China
Static
closed
chamber
April, 2009 –
January, 2010
0.01–1.3
Chen et al.
(2012)
New Caledonia
Mangroves, French
Territory
Static
closed
chamber
September,
2010–2011
−1.2–13.5
Leopold
et al. (2013)
Teremaal, Likupang and
Kema Mangroves,
Indonesia
Static
closed
chamber
April (year not
specified)
−1.4–4.1
Chen et al.
(2014)
New Zealand Mangroves Static
closed
chamber
November
2013–January
2014
7.4 ± 2.0 (intact
mangrove)
Bulmer et al.
(2015)
5.9 ± 1.6 (cleared
mangrove)
Everglades National
Park, USA
Static
closed
chamber
2010 (Annual
cycle)
4.8 ± 0.2 (only soil) Troxler et al.
(2015)
2011 (Annual
cycle)
12.1 ± 0.4 (soil and
pneumatophores)
(continued)
A. Akhand et al.
Table 7.2 Soil CO 2 fluxes recorded in various mangrove forests throughout the world
Site
Method
Time
CO 2 flux
(g CO 2 m
−2 day
−1 )* Authors
Henry Island, Sundarban,
India
Static
closed
chamber
April & May, 2011 5.8 ± 0.6
Chanda et al.
(2011)
Jharkhali& Henry Island,
Sundarban, India
Static
closed
chamber
April, 2011–
March, 2012
(Annual cycle)
0.6–8.9
Chanda et al.
(2014)
Jiulongjiang Estuary,
Fujian Province, China
Semiclosed
chamber
July, 2002
0.7–5.3
Alongi et al.
(2005)
Three sites from
Caribbean; six sites from
Australia; two sites from
New Zealand
Static
closed
chamber
Between April,
2004 and July,
2006
−0.9–11.3
Lovelock
(2008)
Mtoni and Ras
Ex-situ
soil core
September, 2005
1.2–5.1
Kristensen
et al. (2008)
Dege Mangroves,
Tanzania
Gazi Bay, Kenya
Soda-lime
method
October 2004–
January 2006
16.9–33.2
Kirui et al.
(2009)
Trat River Mangroves,
Eastern Thailand
Static
closed
chamber
Dry and Wet
Season of 2006
and 2007
1.7–3.3
Poungparn
et al. (2009)
Shenzhen and Hong
Kong Mangroves, South
China
Static
closed
chamber
July & August,
2008
0.7–21.7
Chen et al.
(2010)
Island of Twin Cays
Mangroves, Belize
Static
closed
chamber
A span of 20 years
(year not specified)
7.9
Lovelock
et al. (2011)
Mai Po Mangroves, Hong
Kong, South China
Static
closed
chamber
April, 2009 –
January, 2010
0.01–1.3
Chen et al.
(2012)
New Caledonia
Mangroves, French
Territory
Static
closed
chamber
September,
2010–2011
−1.2–13.5
Leopold
et al. (2013)
Teremaal, Likupang and
Kema Mangroves,
Indonesia
Static
closed
chamber
April (year not
specified)
−1.4–4.1
Chen et al.
(2014)
New Zealand Mangroves Static
closed
chamber
November
2013–January
2014
7.4 ± 2.0 (intact
mangrove)
Bulmer et al.
(2015)
5.9 ± 1.6 (cleared
mangrove)
Everglades National
Park, USA
Static
closed
chamber
2010 (Annual
cycle)
4.8 ± 0.2 (only soil) Troxler et al.
(2015)
2011 (Annual
cycle)
12.1 ± 0.4 (soil and
pneumatophores)
(continued)
A. Akhand et al.