

194
this regard as seven papers are published on the atmosphere-biosphere CO 2 exchange
(Mukhophadhya et al. 2001, 2002; Ganguly et al. 2008; Ray et al. 2011; Chanda
et al. 2013a, b; Rodda et al. 2016) observed in various sites of Sundarbans between
the time window of the years 2001 and 2016 (the details are discussed later in Sect.
7.5.2). Followed by Sundarbans, few works are reported on the Phangnga National
Park Mangroves of Thailand; however, these works were carried out 15–20 years
ago (Monji et al. 1996, 1997, 2002). Apart from these two sites, in the last decade,
a few works have been done on the Everglades National Park (Barr et al. 2010,
2012) and three mangrove forests of China (Guangzhou, Zhangjiangkou &
Zhanjiang) (Kang et al. 2008; Li et al. 2014).
7.2.2 Net Ecosystem Exchange (NEE) Above Mangrove
Canopy and the Role of Light
The studies conducted so far throughout the world found a negative net ecosystem
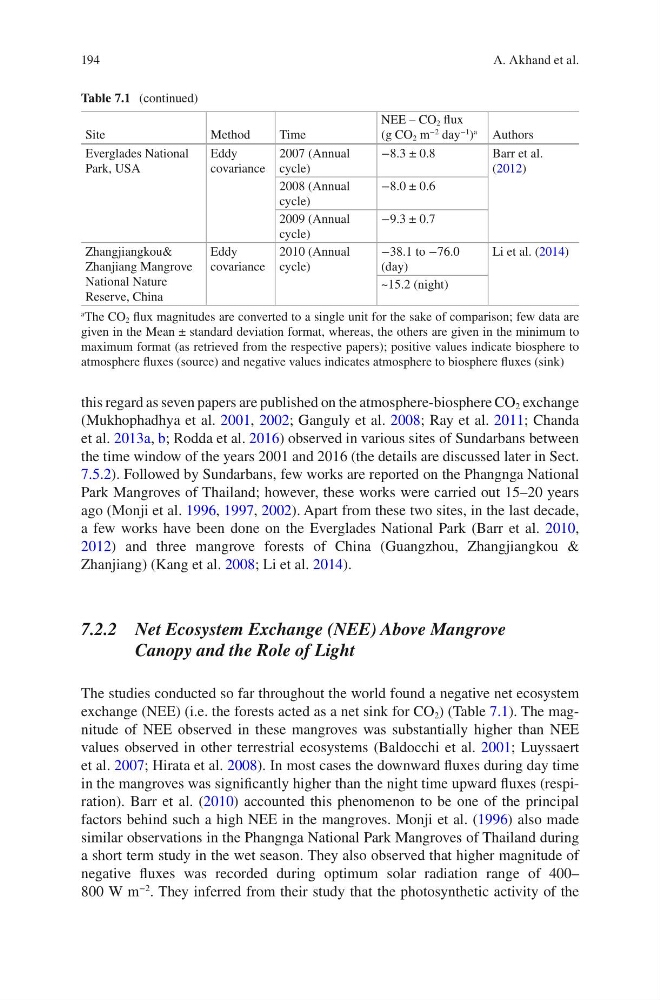
exchange (NEE) (i.e. the forests acted as a net sink for CO 2 ) (Table 7.1). The magnitude of NEE observed in these mangroves was substantially higher than NEE
values observed in other terrestrial ecosystems (Baldocchi et al. 2001; Luyssaert
et al. 2007; Hirata et al. 2008). In most cases the downward fluxes during day time
in the mangroves was significantly higher than the night time upward fluxes (respiration). Barr et al. (2010) accounted this phenomenon to be one of the principal
factors behind such a high NEE in the mangroves. Monji et al. (1996) also made
similar observations in the Phangnga National Park Mangroves of Thailand during
a short term study in the wet season. They also observed that higher magnitude of
negative fluxes was recorded during optimum solar radiation range of 400–
800 W m
−2
. They inferred from their study that the photosynthetic activity of the
Table 7.1 (continued)
Site
Method
Time
NEE – CO 2 flux
(g CO 2 m
−2
day
−1 )
a
Authors
Everglades National
Park, USA
Eddy
covariance
2007 (Annual
cycle)
−8.3 ± 0.8
Barr et al.
(2012)
2008 (Annual
cycle)
−8.0 ± 0.6
2009 (Annual
cycle)
−9.3 ± 0.7
Zhangjiangkou&
Zhanjiang Mangrove
National Nature
Reserve, China
Eddy
covariance
2010 (Annual
cycle)
−38.1 to −76.0
(day)
Li et al. (2014)
~15.2 (night)
a
The CO 2 flux magnitudes are converted to a single unit for the sake of comparison; few data are
given in the Mean ± standard deviation format, whereas, the others are given in the minimum to
maximum format (as retrieved from the respective papers); positive values indicate biosphere to
atmosphere fluxes (source) and negative values indicates atmosphere to biosphere fluxes (sink)
A. Akhand et al.
this regard as seven papers are published on the atmosphere-biosphere CO 2 exchange
(Mukhophadhya et al. 2001, 2002; Ganguly et al. 2008; Ray et al. 2011; Chanda
et al. 2013a, b; Rodda et al. 2016) observed in various sites of Sundarbans between
the time window of the years 2001 and 2016 (the details are discussed later in Sect.
7.5.2). Followed by Sundarbans, few works are reported on the Phangnga National
Park Mangroves of Thailand; however, these works were carried out 15–20 years
ago (Monji et al. 1996, 1997, 2002). Apart from these two sites, in the last decade,
a few works have been done on the Everglades National Park (Barr et al. 2010,
2012) and three mangrove forests of China (Guangzhou, Zhangjiangkou &
Zhanjiang) (Kang et al. 2008; Li et al. 2014).
7.2.2 Net Ecosystem Exchange (NEE) Above Mangrove
Canopy and the Role of Light
The studies conducted so far throughout the world found a negative net ecosystem
exchange (NEE) (i.e. the forests acted as a net sink for CO 2 ) (Table 7.1). The magnitude of NEE observed in these mangroves was substantially higher than NEE
values observed in other terrestrial ecosystems (Baldocchi et al. 2001; Luyssaert
et al. 2007; Hirata et al. 2008). In most cases the downward fluxes during day time
in the mangroves was significantly higher than the night time upward fluxes (respiration). Barr et al. (2010) accounted this phenomenon to be one of the principal
factors behind such a high NEE in the mangroves. Monji et al. (1996) also made
similar observations in the Phangnga National Park Mangroves of Thailand during
a short term study in the wet season. They also observed that higher magnitude of
negative fluxes was recorded during optimum solar radiation range of 400–
800 W m
−2
. They inferred from their study that the photosynthetic activity of the
Table 7.1 (continued)
Site
Method
Time
NEE – CO 2 flux
(g CO 2 m
−2
day
−1 )
a
Authors
Everglades National
Park, USA
Eddy
covariance
2007 (Annual
cycle)
−8.3 ± 0.8
Barr et al.
(2012)
2008 (Annual
cycle)
−8.0 ± 0.6
2009 (Annual
cycle)
−9.3 ± 0.7
Zhangjiangkou&
Zhanjiang Mangrove
National Nature
Reserve, China
Eddy
covariance
2010 (Annual
cycle)
−38.1 to −76.0
(day)
Li et al. (2014)
~15.2 (night)
a
The CO 2 flux magnitudes are converted to a single unit for the sake of comparison; few data are
given in the Mean ± standard deviation format, whereas, the others are given in the minimum to
maximum format (as retrieved from the respective papers); positive values indicate biosphere to
atmosphere fluxes (source) and negative values indicates atmosphere to biosphere fluxes (sink)
A. Akhand et al.