

164
(Baldocchi 2008) and O 2 fluxes between the water and benthic systems (Berg et al.
2003; Kuwae et al. 2006). The CO 2 flux at the atmospheric interface can be quantified by measuring the CO 2 concentration and wind velocity at very high frequencies
(more than 10 Hz). Details of the procedures can be found in Lee et al. (2004). The
measurement length (footprint) of the eddy covariance method is on the order of
several hundred meters to several kilometers in the windward direction, although
the length depends on the installation altitude and environmental conditions such as
wind speed and roughness at the interface. The wide area of the footprint and the
unmanned nature of the operation enable long-term measurements to be made over
wide areas. However, the eddy covariance method requires very expensive instruments and advanced post-processing techniques. Especially in aquatic environments, the raw data may contain low quality signals because of the spatiotemporal
variations of the water and air masses (e.g., the heterogeneity of water and atmosphere). The post-processing procedure for quality control of the data has been
improved to address these issues (e.g, Tokoro and Kuwae 2015, 2018).
Other meteorological methods have been proposed to measure long-term CO 2
fluxes over wide areas. Although they have not been used as much as the eddy covariance method, they are potentially easy-to-use alternatives to the eddy covariance
method. The relaxed eddy accumulation method, which was derived from the eddy
accumulation method, can potentially be applied to atmospheric species for which
fast-response sensors are unavailable (Baldocchi 2014; Businger and Oncley 1990).
The concentrations are measured separately in updraft and downdraft reservoirs
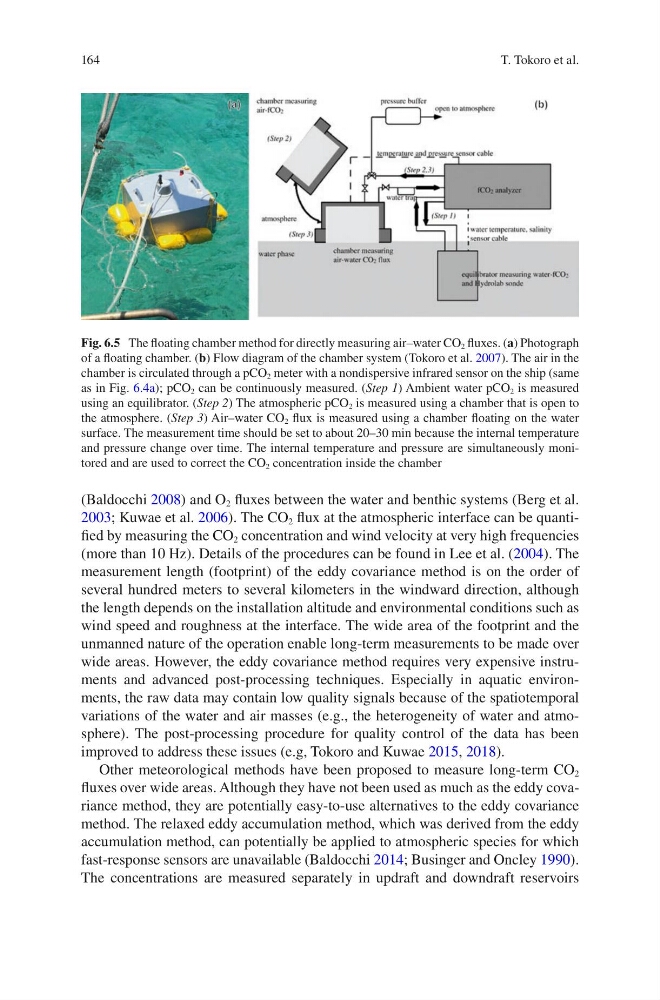
Fig. 6.5 The floating chamber method for directly measuring air–water CO 2 fluxes. (a) Photograph
of a floating chamber. (b) Flow diagram of the chamber system (Tokoro et al. 2007). The air in the
chamber is circulated through a pCO 2 meter with a nondispersive infrared sensor on the ship (same
as in Fig. 6.4a); pCO 2 can be continuously measured. (Step 1) Ambient water pCO 2 is measured
using an equilibrator. (Step 2) The atmospheric pCO 2 is measured using a chamber that is open to
the atmosphere. (Step 3) Air–water CO 2 flux is measured using a chamber floating on the water
surface. The measurement time should be set to about 20–30 min because the internal temperature
and pressure change over time. The internal temperature and pressure are simultaneously monitored and are used to correct the CO 2 concentration inside the chamber
T. Tokoro et al.
(Baldocchi 2008) and O 2 fluxes between the water and benthic systems (Berg et al.
2003; Kuwae et al. 2006). The CO 2 flux at the atmospheric interface can be quantified by measuring the CO 2 concentration and wind velocity at very high frequencies
(more than 10 Hz). Details of the procedures can be found in Lee et al. (2004). The
measurement length (footprint) of the eddy covariance method is on the order of
several hundred meters to several kilometers in the windward direction, although
the length depends on the installation altitude and environmental conditions such as
wind speed and roughness at the interface. The wide area of the footprint and the
unmanned nature of the operation enable long-term measurements to be made over
wide areas. However, the eddy covariance method requires very expensive instruments and advanced post-processing techniques. Especially in aquatic environments, the raw data may contain low quality signals because of the spatiotemporal
variations of the water and air masses (e.g., the heterogeneity of water and atmosphere). The post-processing procedure for quality control of the data has been
improved to address these issues (e.g, Tokoro and Kuwae 2015, 2018).
Other meteorological methods have been proposed to measure long-term CO 2
fluxes over wide areas. Although they have not been used as much as the eddy covariance method, they are potentially easy-to-use alternatives to the eddy covariance
method. The relaxed eddy accumulation method, which was derived from the eddy
accumulation method, can potentially be applied to atmospheric species for which
fast-response sensors are unavailable (Baldocchi 2014; Businger and Oncley 1990).
The concentrations are measured separately in updraft and downdraft reservoirs
Fig. 6.5 The floating chamber method for directly measuring air–water CO 2 fluxes. (a) Photograph
of a floating chamber. (b) Flow diagram of the chamber system (Tokoro et al. 2007). The air in the
chamber is circulated through a pCO 2 meter with a nondispersive infrared sensor on the ship (same
as in Fig. 6.4a); pCO 2 can be continuously measured. (Step 1) Ambient water pCO 2 is measured
using an equilibrator. (Step 2) The atmospheric pCO 2 is measured using a chamber that is open to
the atmosphere. (Step 3) Air–water CO 2 flux is measured using a chamber floating on the water
surface. The measurement time should be set to about 20–30 min because the internal temperature
and pressure change over time. The internal temperature and pressure are simultaneously monitored and are used to correct the CO 2 concentration inside the chamber
T. Tokoro et al.