

148
5.6.4 Carbon Storage in Sediment at Osaka Nanko Bird
Sanctuary
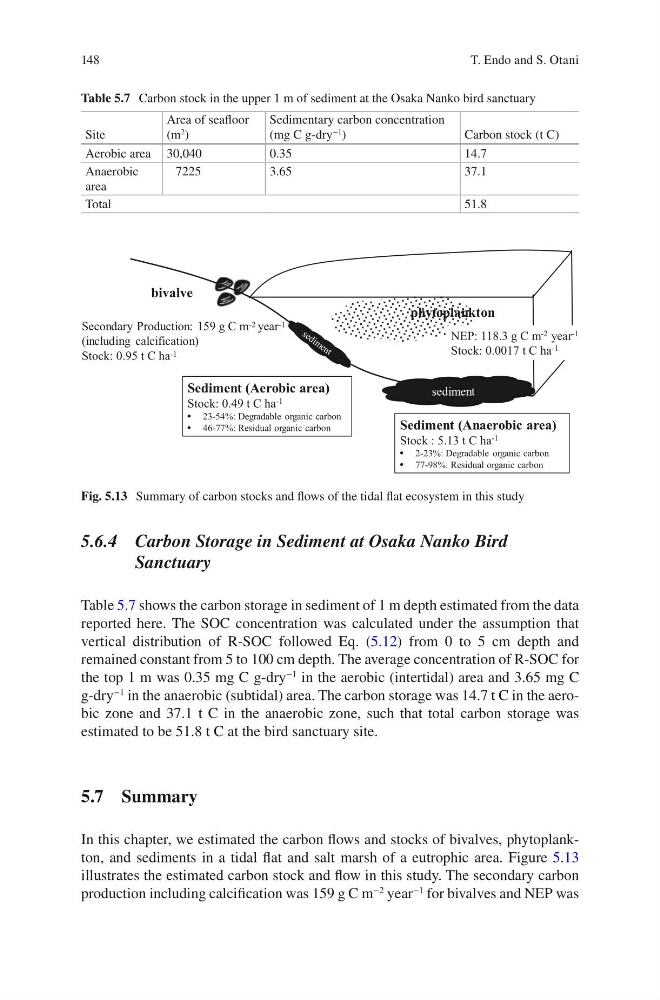
Table 5.7 shows the carbon storage in sediment of 1 m depth estimated from the data
reported here. The SOC concentration was calculated under the assumption that
vertical distribution of R-SOC followed Eq. (5.12) from 0 to 5 cm depth and
remained constant from 5 to 100 cm depth. The average concentration of R-SOC for
the top 1 m was 0.35 mg C g-dry
−1
in the aerobic (intertidal) area and 3.65 mg C
g-dry
−1
in the anaerobic (subtidal) area. The carbon storage was 14.7 t C in the aerobic zone and 37.1 t C in the anaerobic zone, such that total carbon storage was
estimated to be 51.8 t C at the bird sanctuary site.
5.7 Summary
In this chapter, we estimated the carbon flows and stocks of bivalves, phytoplankton, and sediments in a tidal flat and salt marsh of a eutrophic area. Figure 5.13
illustrates the estimated carbon stock and flow in this study. The secondary carbon
production including calcification was 159 g C m
−2
year
−1
for bivalves and NEP was
Secondary Production: 159 g C m -2 year -1
(including calcification)
Stock: 0.95 t C ha -1
sediment
Sediment (Anaerobic area)
Stock : 5.13 t C ha -1
• 2-23%: Degradable organic carbon
• 77-98%: Residual organic carbon
bivalve
phytoplankton
NEP: 118.3 g C m -2 year -1
Stock: 0.0017 t C ha -1
Sediment (Aerobic area)
Stock: 0.49 t C ha -1
• 23-54%: Degradable organic carbon
• 46-77%: Residual organic carbon
Fig. 5.13 Summary of carbon stocks and flows of the tidal flat ecosystem in this study
Table 5.7 Carbon stock in the upper 1 m of sediment at the Osaka Nanko bird sanctuary
Site
Area of seafloor
(m
2 )
Sedimentary carbon concentration
(mg C g-dry
−1
)
Carbon stock (t C)
Aerobic area 30,040
0.35
14.7
Anaerobic
area
7225
3.65
37.1
Total
51.8
T. Endo and S. Otani
5.6.4 Carbon Storage in Sediment at Osaka Nanko Bird
Sanctuary
Table 5.7 shows the carbon storage in sediment of 1 m depth estimated from the data
reported here. The SOC concentration was calculated under the assumption that
vertical distribution of R-SOC followed Eq. (5.12) from 0 to 5 cm depth and
remained constant from 5 to 100 cm depth. The average concentration of R-SOC for
the top 1 m was 0.35 mg C g-dry
−1
in the aerobic (intertidal) area and 3.65 mg C
g-dry
−1
in the anaerobic (subtidal) area. The carbon storage was 14.7 t C in the aerobic zone and 37.1 t C in the anaerobic zone, such that total carbon storage was
estimated to be 51.8 t C at the bird sanctuary site.
5.7 Summary
In this chapter, we estimated the carbon flows and stocks of bivalves, phytoplankton, and sediments in a tidal flat and salt marsh of a eutrophic area. Figure 5.13
illustrates the estimated carbon stock and flow in this study. The secondary carbon
production including calcification was 159 g C m
−2
year
−1
for bivalves and NEP was
Secondary Production: 159 g C m -2 year -1
(including calcification)
Stock: 0.95 t C ha -1
sediment
Sediment (Anaerobic area)
Stock : 5.13 t C ha -1
• 2-23%: Degradable organic carbon
• 77-98%: Residual organic carbon
bivalve
phytoplankton
NEP: 118.3 g C m -2 year -1
Stock: 0.0017 t C ha -1
Sediment (Aerobic area)
Stock: 0.49 t C ha -1
• 23-54%: Degradable organic carbon
• 46-77%: Residual organic carbon
Fig. 5.13 Summary of carbon stocks and flows of the tidal flat ecosystem in this study
Table 5.7 Carbon stock in the upper 1 m of sediment at the Osaka Nanko bird sanctuary
Site
Area of seafloor
(m
2 )
Sedimentary carbon concentration
(mg C g-dry
−1
)
Carbon stock (t C)
Aerobic area 30,040
0.35
14.7
Anaerobic
area
7225
3.65
37.1
Total
51.8
T. Endo and S. Otani