

147
5.6.3 Vertical Distribution of Residual Organic Carbon
in Sediment
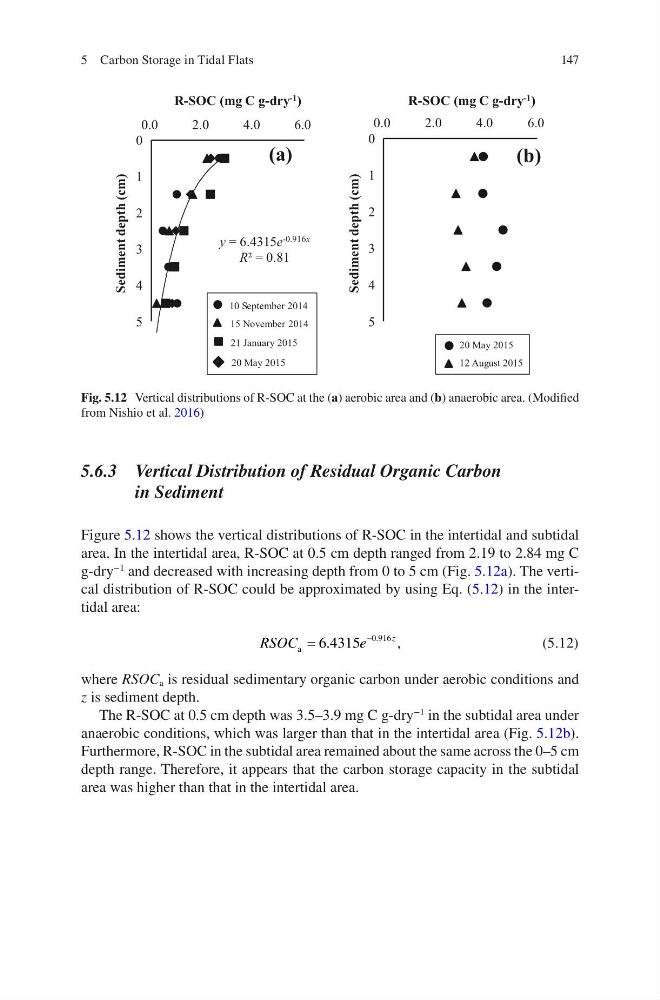
Figure 5.12 shows the vertical distributions of R-SOC in the intertidal and subtidal
area. In the intertidal area, R-SOC at 0.5 cm depth ranged from 2.19 to 2.84 mg C
g-dry
−1
and decreased with increasing depth from 0 to 5 cm (Fig. 5.12a). The vertical distribution of R-SOC could be approximated by using Eq. (5.12) in the intertidal area:
RSOC
e
z
a
,
=
-
6 4315
0 916
.
.
(5.12)
where RSOC a is residual sedimentary organic carbon under aerobic conditions and
z is sediment depth.
The R-SOC at 0.5 cm depth was 3.5–3.9 mg C g-dry
−1
in the subtidal area under
anaerobic conditions, which was larger than that in the intertidal area (Fig. 5.12b).
Furthermore, R-SOC in the subtidal area remained about the same across the 0–5 cm
depth range. Therefore, it appears that the carbon storage capacity in the subtidal
area was higher than that in the intertidal area.
y = 6.4315e -0.916x
R² = 0.81
0
1
2
3
4
5
0.0
2.0
4.0
6.0
Sediment depth (cm)
R-SOC (mg C g-dry -1 )
0
1
2
3
4
5
0.0
2.0
4.0
6.0
Sediment depth (cm)
R-SOC (mg C g-dry -1 )
(a)
(b)
10 September 2014
15 November 2014
21 January 2015
20 May 2015
20 May 2015
12 August 2015
Fig. 5.12 Vertical distributions of R-SOC at the (a) aerobic area and (b) anaerobic area. (Modified
from Nishio et al. 2016)
5 Carbon Storage in Tidal Flats
5.6.3 Vertical Distribution of Residual Organic Carbon
in Sediment
Figure 5.12 shows the vertical distributions of R-SOC in the intertidal and subtidal
area. In the intertidal area, R-SOC at 0.5 cm depth ranged from 2.19 to 2.84 mg C
g-dry
−1
and decreased with increasing depth from 0 to 5 cm (Fig. 5.12a). The vertical distribution of R-SOC could be approximated by using Eq. (5.12) in the intertidal area:
RSOC
e
z
a
,
=
-
6 4315
0 916
.
.
(5.12)
where RSOC a is residual sedimentary organic carbon under aerobic conditions and
z is sediment depth.
The R-SOC at 0.5 cm depth was 3.5–3.9 mg C g-dry
−1
in the subtidal area under
anaerobic conditions, which was larger than that in the intertidal area (Fig. 5.12b).
Furthermore, R-SOC in the subtidal area remained about the same across the 0–5 cm
depth range. Therefore, it appears that the carbon storage capacity in the subtidal
area was higher than that in the intertidal area.
y = 6.4315e -0.916x
R² = 0.81
0
1
2
3
4
5
0.0
2.0
4.0
6.0
Sediment depth (cm)
R-SOC (mg C g-dry -1 )
0
1
2
3
4
5
0.0
2.0
4.0
6.0
Sediment depth (cm)
R-SOC (mg C g-dry -1 )
(a)
(b)
10 September 2014
15 November 2014
21 January 2015
20 May 2015
20 May 2015
12 August 2015
Fig. 5.12 Vertical distributions of R-SOC at the (a) aerobic area and (b) anaerobic area. (Modified
from Nishio et al. 2016)
5 Carbon Storage in Tidal Flats