

141
Figure 5.7b shows the relationship between I opt and the water temperature. I opt
was calculated by using Eq. (5.7), assuming that it follows the Arrhenius equation
(e.g., Robarts and Zohary 1987):
I
T
opt
.
=
(
)
102 9
0063
. exp .
(5.7)
Figure 5.6b shows the relationship between the respiration/decomposition rate in
seawater (R) and the water temperature. Note that there is great variability in R
when water temperature is 30 °C, because data measured on different days are
included in this figure. Like I opt , however, the average value of R increases with
increasing water temperature, so R was calculated by using Eq. (5.8), where T is
water temperature, assuming that the respiration rate follows the Arrhenius equation
as well (e.g., Hirche 1987):
R
T
=
(
)
0 407
0 056
.
exp .
.
(5.8)
Q 10 , which represents the change in metabolic rate associated with a temperature
rise of 10 °C, was 1.75. Q 10 of this experiment was a bit lower than the generally
reported value of 2 to 3, but it was judged to be appropriate.
5.5.2 Carbon Flow and Stock of Phytoplankton
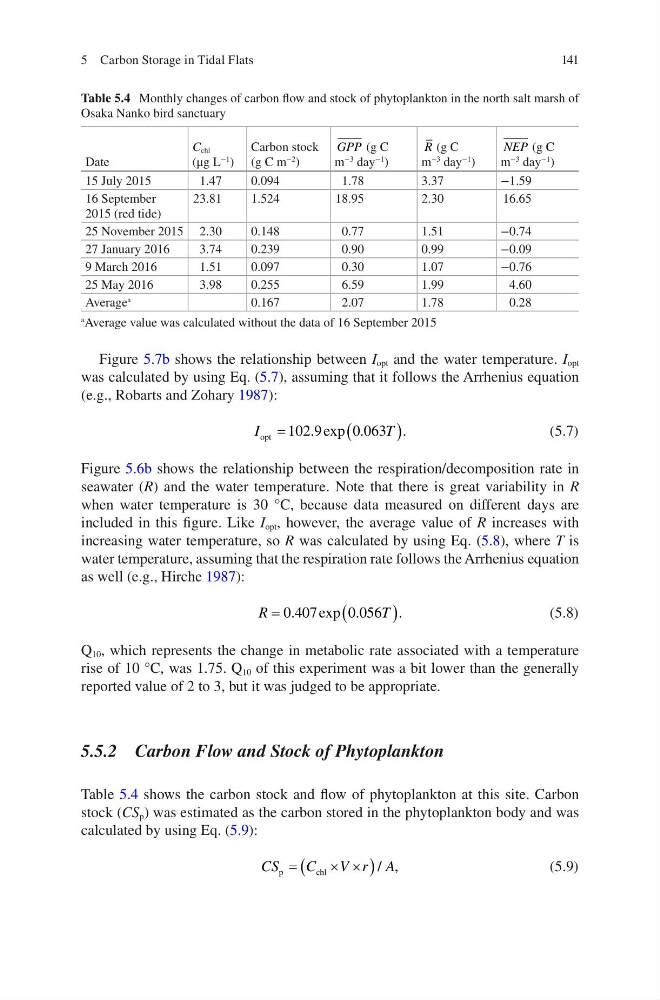
Table 5.4 shows the carbon stock and flow of phytoplankton at this site. Carbon
stock (CS p ) was estimated as the carbon stored in the phytoplankton body and was
calculated by using Eq. (5.9):
CS
C
V r A
p
c hl
,
=
´ ´
(
)/
(5.9)
Table 5.4 Monthly changes of carbon flow and stock of phytoplankton in the north salt marsh of
Osaka Nanko bird sanctuary
Date
C chl
(μg L
−1 )
Carbon stock
(g C m
−2 )
GPP (g C
m
−3 day
−1 )
R (g C
m
−3
day
−1
)
NEP (g C
m
−3 day
−1 )
15 July 2015
1.47
0.094
1.78
3.37
−1.59
16 September
2015 (red tide)
23.81
1.524
18.95
2.30
16.65
25 November 2015 2.30
0.148
0.77
1.51
−0.74
27 January 2016
3.74
0.239
0.90
0.99
−0.09
9 March 2016
1.51
0.097
0.30
1.07
−0.76
25 May 2016
3.98
0.255
6.59
1.99
4.60
Average
a
0.167
2.07
1.78
0.28
a
Average value was calculated without the data of 16 September 2015
5 Carbon Storage in Tidal Flats
Figure 5.7b shows the relationship between I opt and the water temperature. I opt
was calculated by using Eq. (5.7), assuming that it follows the Arrhenius equation
(e.g., Robarts and Zohary 1987):
I
T
opt
.
=
(
)
102 9
0063
. exp .
(5.7)
Figure 5.6b shows the relationship between the respiration/decomposition rate in
seawater (R) and the water temperature. Note that there is great variability in R
when water temperature is 30 °C, because data measured on different days are
included in this figure. Like I opt , however, the average value of R increases with
increasing water temperature, so R was calculated by using Eq. (5.8), where T is
water temperature, assuming that the respiration rate follows the Arrhenius equation
as well (e.g., Hirche 1987):
R
T
=
(
)
0 407
0 056
.
exp .
.
(5.8)
Q 10 , which represents the change in metabolic rate associated with a temperature
rise of 10 °C, was 1.75. Q 10 of this experiment was a bit lower than the generally
reported value of 2 to 3, but it was judged to be appropriate.
5.5.2 Carbon Flow and Stock of Phytoplankton
Table 5.4 shows the carbon stock and flow of phytoplankton at this site. Carbon
stock (CS p ) was estimated as the carbon stored in the phytoplankton body and was
calculated by using Eq. (5.9):
CS
C
V r A
p
c hl
,
=
´ ´
(
)/
(5.9)
Table 5.4 Monthly changes of carbon flow and stock of phytoplankton in the north salt marsh of
Osaka Nanko bird sanctuary
Date
C chl
(μg L
−1 )
Carbon stock
(g C m
−2 )
GPP (g C
m
−3 day
−1 )
R (g C
m
−3
day
−1
)
NEP (g C
m
−3 day
−1 )
15 July 2015
1.47
0.094
1.78
3.37
−1.59
16 September
2015 (red tide)
23.81
1.524
18.95
2.30
16.65
25 November 2015 2.30
0.148
0.77
1.51
−0.74
27 January 2016
3.74
0.239
0.90
0.99
−0.09
9 March 2016
1.51
0.097
0.30
1.07
−0.76
25 May 2016
3.98
0.255
6.59
1.99
4.60
Average
a
0.167
2.07
1.78
0.28
a
Average value was calculated without the data of 16 September 2015
5 Carbon Storage in Tidal Flats