

140
conditions, G p is highest when water temperature is around 20 °C. These data confirm that G p depends on light intensity and water temperature.
Steele (1962) proposed the following model of the relationship between photosynthetic rate of phytoplankton and light intensity:
G G I I
I I
p
m
opt
opt ,
=
×
-
(
)
/
exp
/
1
(5.5)
where G m is the maximum value of G p and I opt is the optimum photon flux density.
G p at each water temperature was approximated by Eq. (5.5) by the method of least
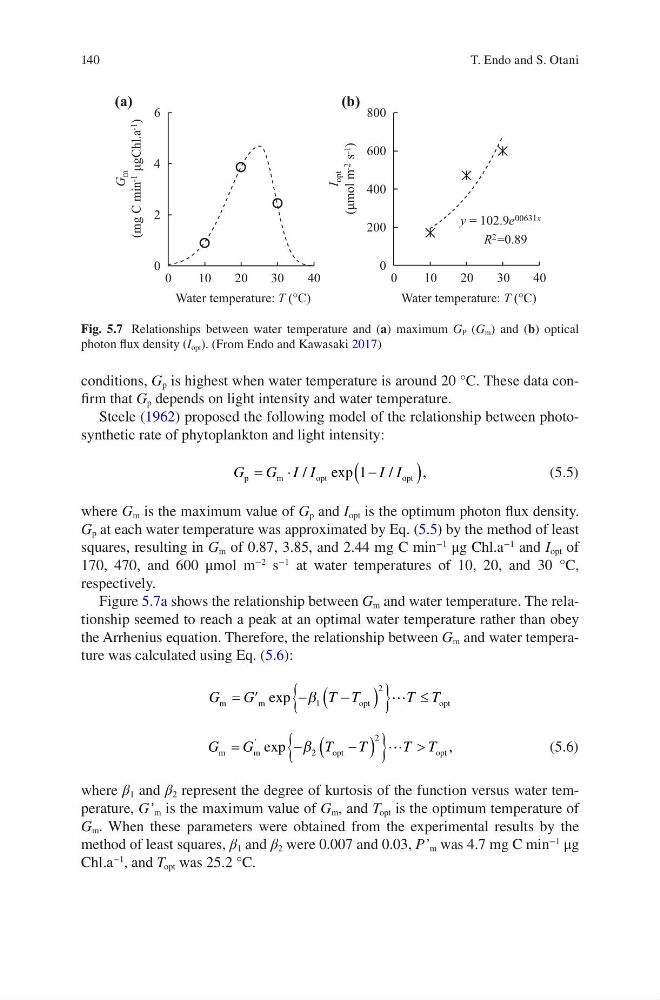
squares, resulting in G m of 0.87, 3.85, and 2.44 mg C min
−1
μg Chl.a
−1
and I opt of
170, 470, and 600 μmol m
−2
s
−1
at water temperatures of 10, 20, and 30 °C,
respectively.
Figure 5.7a shows the relationship between G m and water temperature. The relationship seemed to reach a peak at an optimal water temperature rather than obey
the Arrhenius equation. Therefore, the relationship between G m and water temperature was calculated using Eq. (5.6):
G
G
T T
T T
m
m
opt
opt
= ¢
-
-
(
)
{
} £
exp b 1
2
G
G
T
T
T T
m
m
opt
opt ,
=
-
-
(
)
{
} >
¢ exp b 2
2
(5.6)
where β 1 and β 2 represent the degree of kurtosis of the function versus water temperature, G’ m is the maximum value of G m , and T opt is the optimum temperature of
G m . When these parameters were obtained from the experimental results by the
method of least squares, β 1 and β 2 were 0.007 and 0.03, P’ m was 4.7 mg C min
−1
μg
Chl.a
−1
, and T opt was 25.2 °C.
0
2
4
6
0
10
20
30
40
0
200
400
600
800
0
10
20
30
40
Water temperature: T (°C)
G
m
(mg C min -1
μgChl.a -1
)
Water temperature: T (°C)
I
opt
(μmol m -2
s -1
)
(a)
(b)
y = 102.9e 00631x
R 2 =0.89
Fig. 5.7 Relationships between water temperature and (a) maximum G P (G m ) and (b) optical
photon flux density (I opt ). (From Endo and Kawasaki 2017)
T. Endo and S. Otani
conditions, G p is highest when water temperature is around 20 °C. These data confirm that G p depends on light intensity and water temperature.
Steele (1962) proposed the following model of the relationship between photosynthetic rate of phytoplankton and light intensity:
G G I I
I I
p
m
opt
opt ,
=
×
-
(
)
/
exp
/
1
(5.5)
where G m is the maximum value of G p and I opt is the optimum photon flux density.
G p at each water temperature was approximated by Eq. (5.5) by the method of least
squares, resulting in G m of 0.87, 3.85, and 2.44 mg C min
−1
μg Chl.a
−1
and I opt of
170, 470, and 600 μmol m
−2
s
−1
at water temperatures of 10, 20, and 30 °C,
respectively.
Figure 5.7a shows the relationship between G m and water temperature. The relationship seemed to reach a peak at an optimal water temperature rather than obey
the Arrhenius equation. Therefore, the relationship between G m and water temperature was calculated using Eq. (5.6):
G
G
T T
T T
m
m
opt
opt
= ¢
-
-
(
)
{
} £
exp b 1
2
G
G
T
T
T T
m
m
opt
opt ,
=
-
-
(
)
{
} >
¢ exp b 2
2
(5.6)
where β 1 and β 2 represent the degree of kurtosis of the function versus water temperature, G’ m is the maximum value of G m , and T opt is the optimum temperature of
G m . When these parameters were obtained from the experimental results by the
method of least squares, β 1 and β 2 were 0.007 and 0.03, P’ m was 4.7 mg C min
−1
μg
Chl.a
−1
, and T opt was 25.2 °C.
0
2
4
6
0
10
20
30
40
0
200
400
600
800
0
10
20
30
40
Water temperature: T (°C)
G
m
(mg C min -1
μgChl.a -1
)
Water temperature: T (°C)
I
opt
(μmol m -2
s -1
)
(a)
(b)
y = 102.9e 00631x
R 2 =0.89
Fig. 5.7 Relationships between water temperature and (a) maximum G P (G m ) and (b) optical
photon flux density (I opt ). (From Endo and Kawasaki 2017)
T. Endo and S. Otani