

136
mud (gravel content is ~18%, sand content is 70%, and silt and clay content is
~12%, with ignition loss being about 6–9%).
5.4 Carbon Storage of a Bivalve
We quantified the biomass and secondary production separately for the organic carbon and inorganic carbon fractions of the bivalve Corbicula japonica, which is
dominant in Osaka Bay and distributed in brackish lakes and estuarine tidal flats in
Japan. A field investigation was carried out on the 3000-m
2
muddy tidal flat in the
Yodo River (Fig. 5.3a). From June 2012 to May 2015, samples of C. japonica were
collected using a 1-mm-mesh sieve from quadrats (50 × 50 × 10 cm) at eight stations to examine abundance. The shell length and number of individuals in the collected samples were measured in the laboratory.
Cohort analysis was performed with the frequency distribution of shell lengths
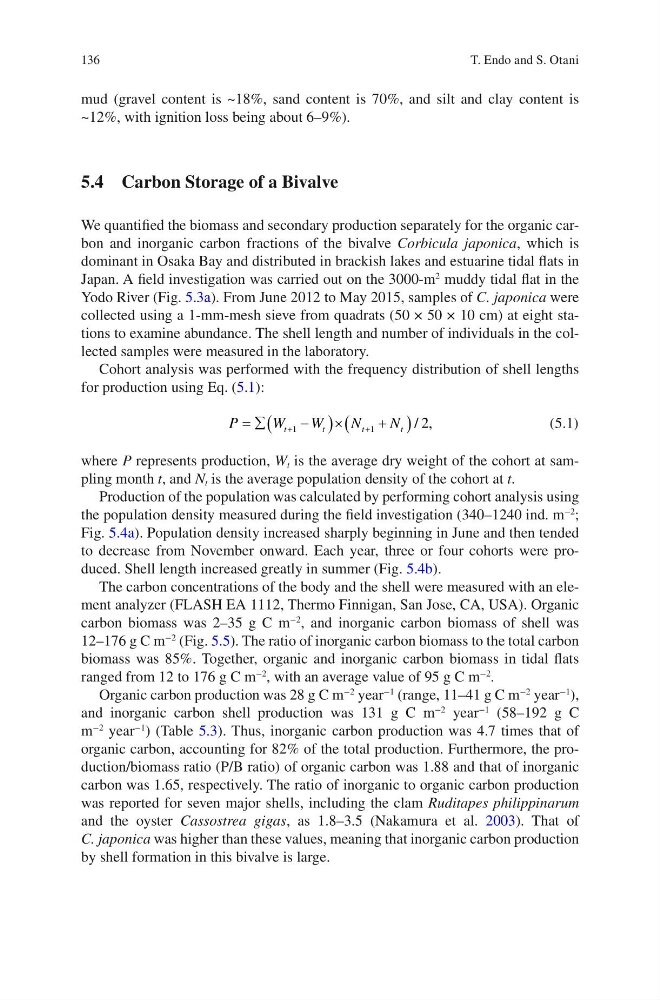
for production using Eq. (5.1):
P
W
W
N
N
t
t
t
t
= å
-
(
)´
+
(
)
+
+
1
1
2
/ ,
(5.1)
where P represents production, W t is the average dry weight of the cohort at sampling month t, and N t is the average population density of the cohort at t.
Production of the population was calculated by performing cohort analysis using
the population density measured during the field investigation (340–1240 ind. m
−2
;
Fig. 5.4a). Population density increased sharply beginning in June and then tended
to decrease from November onward. Each year, three or four cohorts were produced. Shell length increased greatly in summer (Fig. 5.4b).
The carbon concentrations of the body and the shell were measured with an element analyzer (FLASH EA 1112, Thermo Finnigan, San Jose, CA, USA). Organic
carbon biomass was 2–35 g C m
−2
, and inorganic carbon biomass of shell was
12–176 g C m
−2
(Fig. 5.5). The ratio of inorganic carbon biomass to the total carbon
biomass was 85%. Together, organic and inorganic carbon biomass in tidal flats
ranged from 12 to 176 g C m
−2
, with an average value of 95 g C m
−2
.
Organic carbon production was 28 g C m
−2
year
−1
(range, 11–41 g C m
−2
year
−1
),
and inorganic carbon shell production was 131 g C m
−2
year
−1
(58–192 g C
m
−2
year
−1
) (Table 5.3). Thus, inorganic carbon production was 4.7 times that of
organic carbon, accounting for 82% of the total production. Furthermore, the production/biomass ratio (P/B ratio) of organic carbon was 1.88 and that of inorganic
carbon was 1.65, respectively. The ratio of inorganic to organic carbon production
was reported for seven major shells, including the clam Ruditapes philippinarum
and the oyster Cassostrea gigas, as 1.8–3.5 (Nakamura et al. 2003). That of
C. japonica was higher than these values, meaning that inorganic carbon production
by shell formation in this bivalve is large.
T. Endo and S. Otani
mud (gravel content is ~18%, sand content is 70%, and silt and clay content is
~12%, with ignition loss being about 6–9%).
5.4 Carbon Storage of a Bivalve
We quantified the biomass and secondary production separately for the organic carbon and inorganic carbon fractions of the bivalve Corbicula japonica, which is
dominant in Osaka Bay and distributed in brackish lakes and estuarine tidal flats in
Japan. A field investigation was carried out on the 3000-m
2
muddy tidal flat in the
Yodo River (Fig. 5.3a). From June 2012 to May 2015, samples of C. japonica were
collected using a 1-mm-mesh sieve from quadrats (50 × 50 × 10 cm) at eight stations to examine abundance. The shell length and number of individuals in the collected samples were measured in the laboratory.
Cohort analysis was performed with the frequency distribution of shell lengths
for production using Eq. (5.1):
P
W
W
N
N
t
t
t
t
= å
-
(
)´
+
(
)
+
+
1
1
2
/ ,
(5.1)
where P represents production, W t is the average dry weight of the cohort at sampling month t, and N t is the average population density of the cohort at t.
Production of the population was calculated by performing cohort analysis using
the population density measured during the field investigation (340–1240 ind. m
−2
;
Fig. 5.4a). Population density increased sharply beginning in June and then tended
to decrease from November onward. Each year, three or four cohorts were produced. Shell length increased greatly in summer (Fig. 5.4b).
The carbon concentrations of the body and the shell were measured with an element analyzer (FLASH EA 1112, Thermo Finnigan, San Jose, CA, USA). Organic
carbon biomass was 2–35 g C m
−2
, and inorganic carbon biomass of shell was
12–176 g C m
−2
(Fig. 5.5). The ratio of inorganic carbon biomass to the total carbon
biomass was 85%. Together, organic and inorganic carbon biomass in tidal flats
ranged from 12 to 176 g C m
−2
, with an average value of 95 g C m
−2
.
Organic carbon production was 28 g C m
−2
year
−1
(range, 11–41 g C m
−2
year
−1
),
and inorganic carbon shell production was 131 g C m
−2
year
−1
(58–192 g C
m
−2
year
−1
) (Table 5.3). Thus, inorganic carbon production was 4.7 times that of
organic carbon, accounting for 82% of the total production. Furthermore, the production/biomass ratio (P/B ratio) of organic carbon was 1.88 and that of inorganic
carbon was 1.65, respectively. The ratio of inorganic to organic carbon production
was reported for seven major shells, including the clam Ruditapes philippinarum
and the oyster Cassostrea gigas, as 1.8–3.5 (Nakamura et al. 2003). That of
C. japonica was higher than these values, meaning that inorganic carbon production
by shell formation in this bivalve is large.
T. Endo and S. Otani