

132
marshes. The primary production rates was reported to be 29–234 g C m
−2
year
−1
for
benthic microalgae (Colijn and de Jonge 1984; Cahoon 1999; Underwood and
Kromkamp 1999), 7–875 g C m
−2
year
−1
for phytoplankton (Heip et al. 1995; Tada
et al. 1998; Underwood and Kromkamp 1999), 132–1110 g C m
−2
year
−1
for macroalgae such as Ulva rigida and Enteromorpha spp. (Pregnall and Rudy 1985; Sfriso
et al. 1993), and 1298–2610 g C m
−2
year
−1
for vascular plants (Liao et al. 2007;
Sousa et al. 2010; González-Alcaraz et al. 2012). Studies show that the production
rate increases as the individual becomes larger. The secondary production rates of
bivalves were reported to be 11.4 g C m
−2
year
−1
for Cerastoderma edule (Sauriau
and Kang 2000) and 96.5 g C m
−2
year
−1
for Ruditapes philippinarum (Komorita
et al. 2014). The calcification rate of bivalves was reported to be 26.5 g C m
−2
year
−1
for Potamocorbula amurensis (Chauvaud et al. 2003) and 46 g C m
−2
year
−1
for
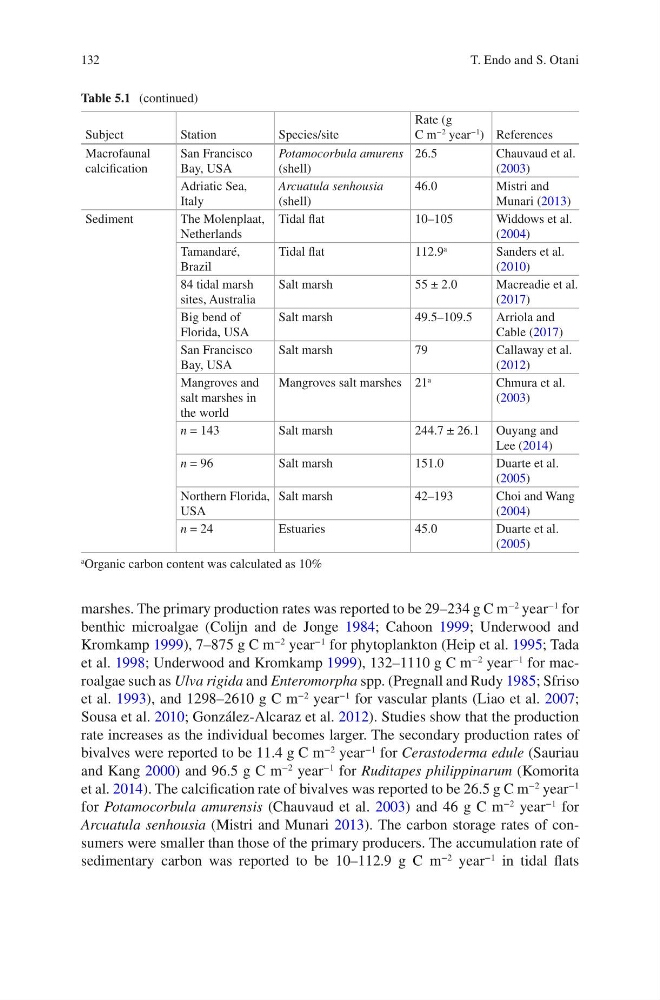
Arcuatula senhousia (Mistri and Munari 2013). The carbon storage rates of consumers were smaller than those of the primary producers. The accumulation rate of
sedimentary carbon was reported to be 10–112.9 g C m
−2
year
−1
in tidal flats
Table 5.1 (continued)
Subject
Station
Species/site
Rate (g
C m
−2 year
−1
) References
Macrofaunal
calcification
San Francisco
Bay, USA
Potamocorbula amurens
(shell)
26.5
Chauvaud et al.
(2003)
Adriatic Sea,
Italy
Arcuatula senhousia
(shell)
46.0
Mistri and
Munari (2013)
Sediment
The Molenplaat,
Netherlands
Tidal flat
10–105
Widdows et al.
(2004)
Tamandaré,
Brazil
Tidal flat
112.9
a
Sanders et al.
(2010)
84 tidal marsh
sites, Australia
Salt marsh
55 ± 2.0
Macreadie et al.
(2017)
Big bend of
Florida, USA
Salt marsh
49.5–109.5
Arriola and
Cable (2017)
San Francisco
Bay, USA
Salt marsh
79
Callaway et al.
(2012)
Mangroves and
salt marshes in
the world
Mangroves salt marshes 21
a
Chmura et al.
(2003)
n = 143
Salt marsh
244.7 ± 26.1 Ouyang and
Lee (2014)
n = 96
Salt marsh
151.0
Duarte et al.
(2005)
Northern Florida,
USA
Salt marsh
42–193
Choi and Wang
(2004)
n = 24
Estuaries
45.0
Duarte et al.
(2005)
a Organic carbon content was calculated as 10%
T. Endo and S. Otani
marshes. The primary production rates was reported to be 29–234 g C m
−2
year
−1
for
benthic microalgae (Colijn and de Jonge 1984; Cahoon 1999; Underwood and
Kromkamp 1999), 7–875 g C m
−2
year
−1
for phytoplankton (Heip et al. 1995; Tada
et al. 1998; Underwood and Kromkamp 1999), 132–1110 g C m
−2
year
−1
for macroalgae such as Ulva rigida and Enteromorpha spp. (Pregnall and Rudy 1985; Sfriso
et al. 1993), and 1298–2610 g C m
−2
year
−1
for vascular plants (Liao et al. 2007;
Sousa et al. 2010; González-Alcaraz et al. 2012). Studies show that the production
rate increases as the individual becomes larger. The secondary production rates of
bivalves were reported to be 11.4 g C m
−2
year
−1
for Cerastoderma edule (Sauriau
and Kang 2000) and 96.5 g C m
−2
year
−1
for Ruditapes philippinarum (Komorita
et al. 2014). The calcification rate of bivalves was reported to be 26.5 g C m
−2
year
−1
for Potamocorbula amurensis (Chauvaud et al. 2003) and 46 g C m
−2
year
−1
for
Arcuatula senhousia (Mistri and Munari 2013). The carbon storage rates of consumers were smaller than those of the primary producers. The accumulation rate of
sedimentary carbon was reported to be 10–112.9 g C m
−2
year
−1
in tidal flats
Table 5.1 (continued)
Subject
Station
Species/site
Rate (g
C m
−2 year
−1
) References
Macrofaunal
calcification
San Francisco
Bay, USA
Potamocorbula amurens
(shell)
26.5
Chauvaud et al.
(2003)
Adriatic Sea,
Italy
Arcuatula senhousia
(shell)
46.0
Mistri and
Munari (2013)
Sediment
The Molenplaat,
Netherlands
Tidal flat
10–105
Widdows et al.
(2004)
Tamandaré,
Brazil
Tidal flat
112.9
a
Sanders et al.
(2010)
84 tidal marsh
sites, Australia
Salt marsh
55 ± 2.0
Macreadie et al.
(2017)
Big bend of
Florida, USA
Salt marsh
49.5–109.5
Arriola and
Cable (2017)
San Francisco
Bay, USA
Salt marsh
79
Callaway et al.
(2012)
Mangroves and
salt marshes in
the world
Mangroves salt marshes 21
a
Chmura et al.
(2003)
n = 143
Salt marsh
244.7 ± 26.1 Ouyang and
Lee (2014)
n = 96
Salt marsh
151.0
Duarte et al.
(2005)
Northern Florida,
USA
Salt marsh
42–193
Choi and Wang
(2004)
n = 24
Estuaries
45.0
Duarte et al.
(2005)
a Organic carbon content was calculated as 10%
T. Endo and S. Otani