

40
Y. Kumazawa et al.
L41 57m L4296
L4437
fND2-3 fN02-1
~ ~
~ ----------~~~~~~----------~
A~
ND2
~
------------~~~------------ .... ~
~
fND2-2
__
__
fN02-4
HSS40 HS63S
HS934m
~724m
fCytb-~~tb-l
B ~========~:C:Yt=b:=~~======~ ~fcytb-2
........
~ fcytb-4
H15915 H15990
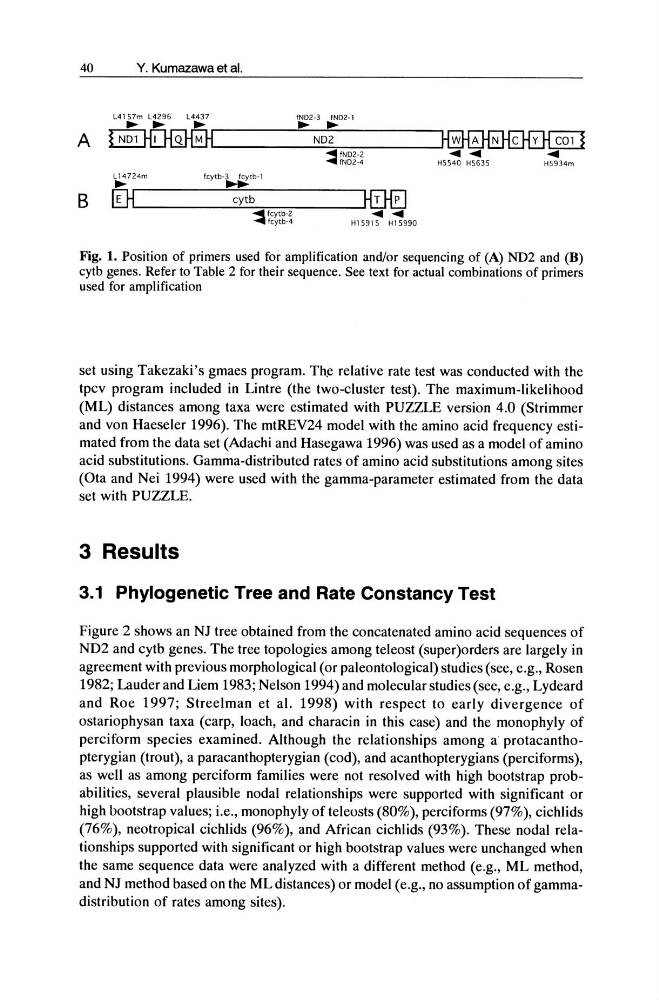
Fig. 1. Position of primers used for amplification and/or sequencing of (A) ND2 and (B)
cytb genes. Refer to Table 2 for their sequence. See text for actual combinations of primers
used for amplification
set using Takezaki's gmaes program. Th,e relative rate test was conducted with the
tpcv program included in Lintre (the two-cluster test). The maximum-likelihood
(ML) distances among taxa were estimated with PUZZLE version 4.0 (Strimmer
and von Haeseler 1996). The mtREV24 model with the amino acid frequency estimated from the data set (Adachi and Hasegawa 1996) was used as a model of amino
acid substitutions. Gamma-distributed rates of amino acid substitutions among sites
(Ota and Nei 1994) were used with the gamma-parameter estimated from the data
set with PUZZLE.
3 Results
3.1 Phylogenetic Tree and Rate Constancy Test
Figure 2 shows an NJ tree obtained from the concatenated amino acid sequences of
ND2 and cytb genes. The tree topologies among teleost (super)orders are largely in
agreement with previous morphological (or paleontological) studies (see, e.g., Rosen
1982; Lauder and Liem 1983; Nelson 1994) and molecular studies (see, e.g., Lydeard
and Roe 1997; Streelman et al. 1998) with respect to early divergence of
ostariophysan taxa (carp, loach, and characin in this case) and the monophyly of
perciform species examined. Although the relationships among a protacanthopterygian (trout), a paracanthopterygian (cod), and acanthopterygians (perciforms),
as well as among perciform families were not resolved with high bootstrap probabilities, several plausible nodal relationships were supported with significant or
high bootstrap values; i.e., monophyly of teleosts (80%), perciforms (97%), cichlids
(76%), neotropical cichlids (96%), and African cichlids (93%). These nodal relationships supported with significant or high bootstrap values were unchanged when
the same sequence data were analyzed with a different method (e.g., ML method,
and NJ method based on the ML distances) or model (e.g., no assumption of gammadistribution of rates among sites).
Y. Kumazawa et al.
L41 57m L4296
L4437
fND2-3 fN02-1
~ ~
~ ----------~~~~~~----------~
A~
ND2
~
------------~~~------------ .... ~
~
fND2-2
__
__
fN02-4
HSS40 HS63S
HS934m
~724m
fCytb-~~tb-l
B ~========~:C:Yt=b:=~~======~ ~fcytb-2
........
~ fcytb-4
H15915 H15990
Fig. 1. Position of primers used for amplification and/or sequencing of (A) ND2 and (B)
cytb genes. Refer to Table 2 for their sequence. See text for actual combinations of primers
used for amplification
set using Takezaki's gmaes program. Th,e relative rate test was conducted with the
tpcv program included in Lintre (the two-cluster test). The maximum-likelihood
(ML) distances among taxa were estimated with PUZZLE version 4.0 (Strimmer
and von Haeseler 1996). The mtREV24 model with the amino acid frequency estimated from the data set (Adachi and Hasegawa 1996) was used as a model of amino
acid substitutions. Gamma-distributed rates of amino acid substitutions among sites
(Ota and Nei 1994) were used with the gamma-parameter estimated from the data
set with PUZZLE.
3 Results
3.1 Phylogenetic Tree and Rate Constancy Test
Figure 2 shows an NJ tree obtained from the concatenated amino acid sequences of
ND2 and cytb genes. The tree topologies among teleost (super)orders are largely in
agreement with previous morphological (or paleontological) studies (see, e.g., Rosen
1982; Lauder and Liem 1983; Nelson 1994) and molecular studies (see, e.g., Lydeard
and Roe 1997; Streelman et al. 1998) with respect to early divergence of
ostariophysan taxa (carp, loach, and characin in this case) and the monophyly of
perciform species examined. Although the relationships among a protacanthopterygian (trout), a paracanthopterygian (cod), and acanthopterygians (perciforms),
as well as among perciform families were not resolved with high bootstrap probabilities, several plausible nodal relationships were supported with significant or
high bootstrap values; i.e., monophyly of teleosts (80%), perciforms (97%), cichlids
(76%), neotropical cichlids (96%), and African cichlids (93%). These nodal relationships supported with significant or high bootstrap values were unchanged when
the same sequence data were analyzed with a different method (e.g., ML method,
and NJ method based on the ML distances) or model (e.g., no assumption of gammadistribution of rates among sites).