

280
R.M. Zink and J. K1icka
mum likelihood tree, both with and without a molecular clock assumption, for the
21 species that are represented by ca. 1000 bp of cytochrome b. For the analysis in
which a molecular clock was enforced, we rooted the tree at the midpoint; rooting
on an ingroup taxon results in a spurious result (Klicka and Zink 1998). To assess
whether the sequences are evolving in a clock-like fashion, a log-likelihood ratio
test (LRT) can be performed by comparing twice the difference between the loglikelihoods for each tree to a chi-squared distribution with n-2 df, where n is the
number of taxa (Huelsenbeck and Rannala 1997). A nonsignificant chi-squared
value indicates no significant departure from a clock-like pattern of sequence evolution. We recognize that this test has been questioned (Goldman 1993), and we
also question the computation of the df; however, it is the most commonly used test
available.
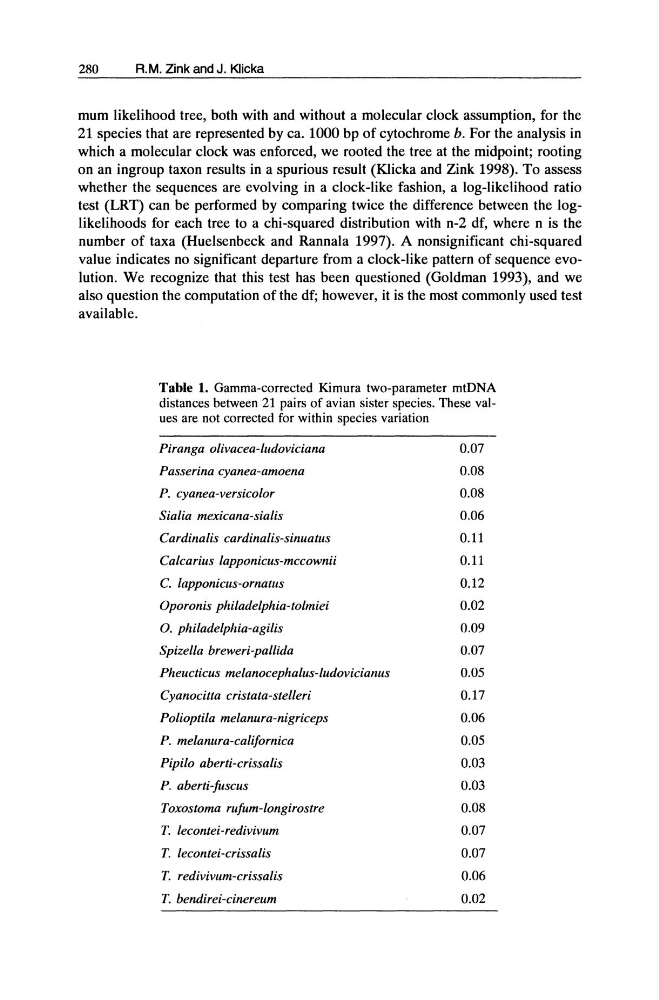
Table 1. Gamma-corrected Kimura two-parameter mtDNA
distances between 21 pairs of avian sister species. These values are not corrected for within species variation
Piranga olivacea-llldoviciana
Passerina cyanea-amoena
P. cyanea-versicolor
Sialia mexicana-sialis
Cardinalis cardinalis-sinuatus
Calcarius lapponicus-mccownii
C. lapponicus-ornatlls
Oporonis philadelphia-tolmiei
o. philadelphia-agilis
Spizella breweri-pallida
Pheucticus melanocephalus-ilidovicialllls
Cyanocitta cristata-stelleri
Polioptila melanura-nigriceps
P. melanllra-californica
Pipilo aberti-crissalis
P. aberti-fuscus
Toxostoma rllfum-longirostre
T. lecontei-redivivum
T. lecontei-crissalis
T. redivivllm-crissalis
T. bendirei-cinereum
0.07
0.08
0.08
0.06
0.11
0.11
0.12
0.02
0.09
0.07
0.05
0.17
0.06
0.05
0.03
0.03
0.08
0.07
0.07
0.06
0.02
R.M. Zink and J. K1icka
mum likelihood tree, both with and without a molecular clock assumption, for the
21 species that are represented by ca. 1000 bp of cytochrome b. For the analysis in
which a molecular clock was enforced, we rooted the tree at the midpoint; rooting
on an ingroup taxon results in a spurious result (Klicka and Zink 1998). To assess
whether the sequences are evolving in a clock-like fashion, a log-likelihood ratio
test (LRT) can be performed by comparing twice the difference between the loglikelihoods for each tree to a chi-squared distribution with n-2 df, where n is the
number of taxa (Huelsenbeck and Rannala 1997). A nonsignificant chi-squared
value indicates no significant departure from a clock-like pattern of sequence evolution. We recognize that this test has been questioned (Goldman 1993), and we
also question the computation of the df; however, it is the most commonly used test
available.
Table 1. Gamma-corrected Kimura two-parameter mtDNA
distances between 21 pairs of avian sister species. These values are not corrected for within species variation
Piranga olivacea-llldoviciana
Passerina cyanea-amoena
P. cyanea-versicolor
Sialia mexicana-sialis
Cardinalis cardinalis-sinuatus
Calcarius lapponicus-mccownii
C. lapponicus-ornatlls
Oporonis philadelphia-tolmiei
o. philadelphia-agilis
Spizella breweri-pallida
Pheucticus melanocephalus-ilidovicialllls
Cyanocitta cristata-stelleri
Polioptila melanura-nigriceps
P. melanllra-californica
Pipilo aberti-crissalis
P. aberti-fuscus
Toxostoma rllfum-longirostre
T. lecontei-redivivum
T. lecontei-crissalis
T. redivivllm-crissalis
T. bendirei-cinereum
0.07
0.08
0.08
0.06
0.11
0.11
0.12
0.02
0.09
0.07
0.05
0.17
0.06
0.05
0.03
0.03
0.08
0.07
0.07
0.06
0.02