

Population Ne
Increase
Mismatch
f
Distribution
Lineages
Through
Time
Glacial
retreat
Time
o
Time --- 0
18. Glaciation and Avian Evolution
279
Ln #
Lineages
S
Dispersal
Direction
Latitude
N
Population Biology:
Ne «< Current
Census
Size
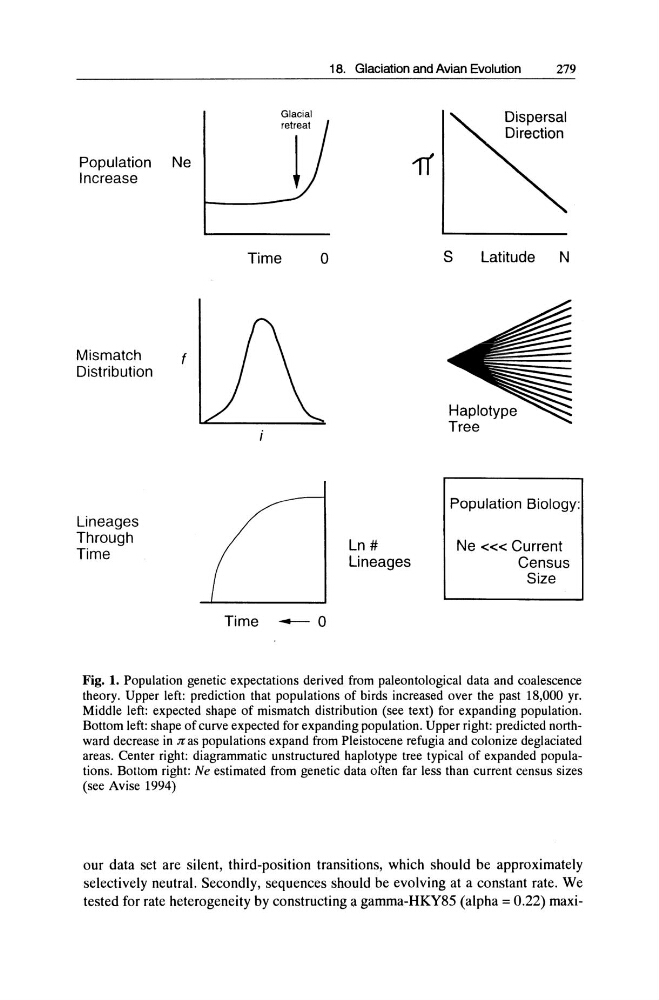
Fig. 1. Population genetic expectations derived from paleontological data and coalescence
theory. Upper left: prediction that populations of birds increased over the past 18,000 yr.
Middle left: expected shape of mismatch distribution (see text) for expanding population.
Bottom left: shape of curve expected for expanding population. Upper right: predicted northward decrease in Jf as populations expand from Pleistocene refugia and colonize deglaciated
areas. Center right: diagrammatic unstructured haplotype tree typical of expanded populations. Bottom right: Ne estimated from genetic data often far less than current census sizes
(see Avise 1994)
our data set are silent, third-position transitions, which should be approximately
selectively neutral. Secondly, sequences should be evolving at a constant rate. We
tested for rate heterogeneity by constructing a gamma-HKY85 (alpha = 0.22) maxi-
Increase
Mismatch
f
Distribution
Lineages
Through
Time
Glacial
retreat
Time
o
Time --- 0
18. Glaciation and Avian Evolution
279
Ln #
Lineages
S
Dispersal
Direction
Latitude
N
Population Biology:
Ne «< Current
Census
Size
Fig. 1. Population genetic expectations derived from paleontological data and coalescence
theory. Upper left: prediction that populations of birds increased over the past 18,000 yr.
Middle left: expected shape of mismatch distribution (see text) for expanding population.
Bottom left: shape of curve expected for expanding population. Upper right: predicted northward decrease in Jf as populations expand from Pleistocene refugia and colonize deglaciated
areas. Center right: diagrammatic unstructured haplotype tree typical of expanded populations. Bottom right: Ne estimated from genetic data often far less than current census sizes
(see Avise 1994)
our data set are silent, third-position transitions, which should be approximately
selectively neutral. Secondly, sequences should be evolving at a constant rate. We
tested for rate heterogeneity by constructing a gamma-HKY85 (alpha = 0.22) maxi-