

17. Genetic Diversity of Primate Color Vision
265
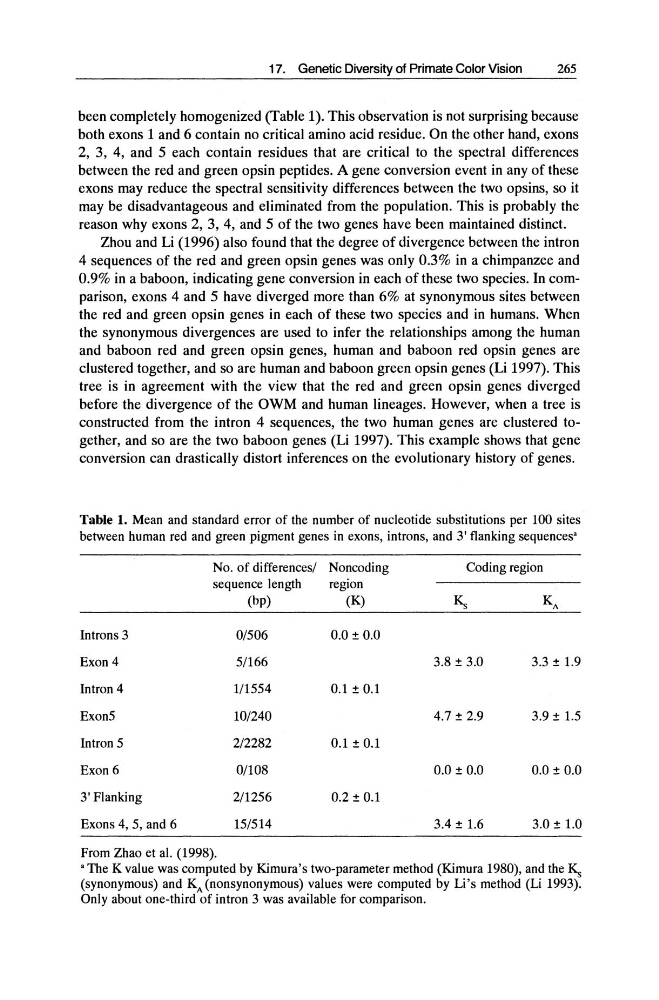
been completely homogenized (Table 1). This observation is not surprising because
both exons 1 and 6 contain no critical amino acid residue. On the other hand, exons
2, 3, 4, and 5 each contain residues that are critical to the spectral differences
between the red and green opsin peptides. A gene conversion event in any of these
exons may reduce the spectral sensitivity differences between the two opsins, so it
may be disadvantageous and eliminated from the population. This is probably the
reason why exons 2, 3, 4,· and 5 of the two genes have been maintained distinct.
Zhou and Li (1996) also found that the degree of divergence between the intron
4 sequences of the red and green opsin genes was only 0.3% in a chimpanzee and
0.9% in a baboon, indicating gene conversion in each of these two species. In comparison, exons 4 and 5 have diverged more than 6% at synonymous sites between
the red and green opsin genes in each of these two species and in humans. When
the synonymous divergences are used to infer the relationships among the human
and baboon red and green opsin genes, human and baboon red opsin genes are
clustered together, and so are human and baboon green opsin genes (Li 1997). This
tree is in agreement with the view that the red and green opsin genes diverged
before the divergence of the OWM and human lineages. However, when a tree is
constructed from the intron 4 sequences, the two human genes are clustered together, and so are the two baboon genes (Li 1997). This example shows that gene
conversion can drastically distort inferences on the evolutionary history of genes.
Table 1. Mean and standard error of the number of nucleotide substitutions per 100 sites
between human red and green pigment genes in exons, introns, and 3' flanking sequences'
No. of differences/ Noncoding
Coding region
sequence length
region
(bp)
(K)
K,;
KA
Introns 3
0/506
0.0 ± 0.0
Exon4
5/166
3.8 ± 3.0
3.3 ± 1.9
Intron 4
1/1554
0.1 ± 0.1
Exon5
10/240
4.7 ± 2.9
3.9 ± 1.5
Intron 5
2/2282
0.1 ± 0.1
Exon6
0/108
0.0 ± 0.0
0.0 ± 0.0
3' Flanking
2/1256
0.2 ± 0.1
Exons 4, 5, and 6
15/514
3.4 ± 1.6
3.0 ± 1.0
From Zhao et al. (1998).
'The K value was computed by Kimura's two-parameter method (Kimura 1980), and the K,;
(synonymous) and KA (nonsynonymous) values were computed by Li's method (Li 1993).
Only about one-third of intron 3 was available for comparison.
265
been completely homogenized (Table 1). This observation is not surprising because
both exons 1 and 6 contain no critical amino acid residue. On the other hand, exons
2, 3, 4, and 5 each contain residues that are critical to the spectral differences
between the red and green opsin peptides. A gene conversion event in any of these
exons may reduce the spectral sensitivity differences between the two opsins, so it
may be disadvantageous and eliminated from the population. This is probably the
reason why exons 2, 3, 4,· and 5 of the two genes have been maintained distinct.
Zhou and Li (1996) also found that the degree of divergence between the intron
4 sequences of the red and green opsin genes was only 0.3% in a chimpanzee and
0.9% in a baboon, indicating gene conversion in each of these two species. In comparison, exons 4 and 5 have diverged more than 6% at synonymous sites between
the red and green opsin genes in each of these two species and in humans. When
the synonymous divergences are used to infer the relationships among the human
and baboon red and green opsin genes, human and baboon red opsin genes are
clustered together, and so are human and baboon green opsin genes (Li 1997). This
tree is in agreement with the view that the red and green opsin genes diverged
before the divergence of the OWM and human lineages. However, when a tree is
constructed from the intron 4 sequences, the two human genes are clustered together, and so are the two baboon genes (Li 1997). This example shows that gene
conversion can drastically distort inferences on the evolutionary history of genes.
Table 1. Mean and standard error of the number of nucleotide substitutions per 100 sites
between human red and green pigment genes in exons, introns, and 3' flanking sequences'
No. of differences/ Noncoding
Coding region
sequence length
region
(bp)
(K)
K,;
KA
Introns 3
0/506
0.0 ± 0.0
Exon4
5/166
3.8 ± 3.0
3.3 ± 1.9
Intron 4
1/1554
0.1 ± 0.1
Exon5
10/240
4.7 ± 2.9
3.9 ± 1.5
Intron 5
2/2282
0.1 ± 0.1
Exon6
0/108
0.0 ± 0.0
0.0 ± 0.0
3' Flanking
2/1256
0.2 ± 0.1
Exons 4, 5, and 6
15/514
3.4 ± 1.6
3.0 ± 1.0
From Zhao et al. (1998).
'The K value was computed by Kimura's two-parameter method (Kimura 1980), and the K,;
(synonymous) and KA (nonsynonymous) values were computed by Li's method (Li 1993).
Only about one-third of intron 3 was available for comparison.