

12. Functional Differentiation and Positive Feedback
181
to detect whether species differentiation is an assembly rule of tree communities.
Employing a non-destructive technique of estimating ecosystem attributes, we can
also analyze the relationship between ecosystem functions and tree community dynamics simultaneously at the same research plots.
This chapter examines data of forest plots over a climatic gradient in relation to
a quantitative simulation model of the size-structure dynamics of forest trees, and
presents a conceptual framework to interface ecological negative feedback and evolutionary positive feedback.
2 Geographic Pattern of Ecosystem Measures
and Diversity
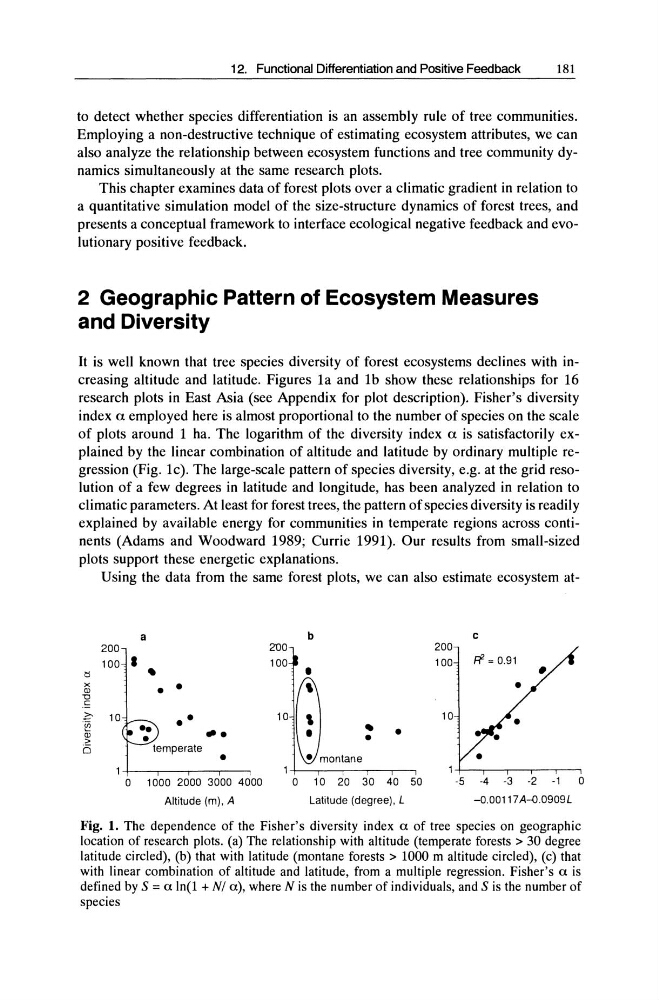
It is well known that tree species diversity of forest ecosystems declines with increasing altitude and latitude. Figures 1a and 1b show these relationships for 16
research plots in East Asia (see Appendix for plot description). Fisher's diversity
index a employed here is almost proportional to the number of species on the scale
of plots around 1 ha. The logarithm of the diversity index a is satisfactorily explained by the linear combination of altitude and latitude by ordinary multiple regression (Fig. 1c). The large-scale pattern of species diversity, e.g. at the grid resolution of a few degrees in latitude and longitude, has been analyzed in relation to
climatic parameters. At least for forest trees, the pattern of species diversity is readily
explained by available energy for communities in temperate regions across continents (Adams and Woodward 1989; Currie 1991). Our results from small-sized
plots support these energetic explanations.
Using the data from the same forest plots, we can also estimate ecosystem ata
b
c
200
2'00
200
100
•
100
100
Ff = 0.91
b
•
I
•
x
• •
G
OJ
'0
.' =
.~
10
••
10 , . 10
(f)
••
m
"' .
I
•
•
>
•
(5
temperate
•
• montane
•
1
1
1
0 1000 2000 3000 4000
0 10 20 30 40 50
-5 -4 -3 -2 -1
0
Altitude (m). A
Latitude (degree), L
-0.00117 A--{).0909L
Fig. 1. The dependence of the Fisher's diversity index a of tree species on geographic
location of research plots. (a) The relationship with altitude (temperate forests> 30 degree
latitude circled), (b) that with latitude (montane forests> 1000 m altitude circled), (c) that
with linear combination of altitude and latitude, from a multiple regression. Fisher's a is
defined by S = a In(l + N/ a), where N is the number of individuals, and S is the number of
species
181
to detect whether species differentiation is an assembly rule of tree communities.
Employing a non-destructive technique of estimating ecosystem attributes, we can
also analyze the relationship between ecosystem functions and tree community dynamics simultaneously at the same research plots.
This chapter examines data of forest plots over a climatic gradient in relation to
a quantitative simulation model of the size-structure dynamics of forest trees, and
presents a conceptual framework to interface ecological negative feedback and evolutionary positive feedback.
2 Geographic Pattern of Ecosystem Measures
and Diversity
It is well known that tree species diversity of forest ecosystems declines with increasing altitude and latitude. Figures 1a and 1b show these relationships for 16
research plots in East Asia (see Appendix for plot description). Fisher's diversity
index a employed here is almost proportional to the number of species on the scale
of plots around 1 ha. The logarithm of the diversity index a is satisfactorily explained by the linear combination of altitude and latitude by ordinary multiple regression (Fig. 1c). The large-scale pattern of species diversity, e.g. at the grid resolution of a few degrees in latitude and longitude, has been analyzed in relation to
climatic parameters. At least for forest trees, the pattern of species diversity is readily
explained by available energy for communities in temperate regions across continents (Adams and Woodward 1989; Currie 1991). Our results from small-sized
plots support these energetic explanations.
Using the data from the same forest plots, we can also estimate ecosystem ata
b
c
200
2'00
200
100
•
100
100
Ff = 0.91
b
•
I
•
x
• •
G
OJ
'0
.' =
.~
10
••
10 , . 10
(f)
••
m
"' .
I
•
•
>
•
(5
temperate
•
• montane
•
1
1
1
0 1000 2000 3000 4000
0 10 20 30 40 50
-5 -4 -3 -2 -1
0
Altitude (m). A
Latitude (degree), L
-0.00117 A--{).0909L
Fig. 1. The dependence of the Fisher's diversity index a of tree species on geographic
location of research plots. (a) The relationship with altitude (temperate forests> 30 degree
latitude circled), (b) that with latitude (montane forests> 1000 m altitude circled), (c) that
with linear combination of altitude and latitude, from a multiple regression. Fisher's a is
defined by S = a In(l + N/ a), where N is the number of individuals, and S is the number of
species