

4. Methods of Estimating Belowground Net Primary Production
65
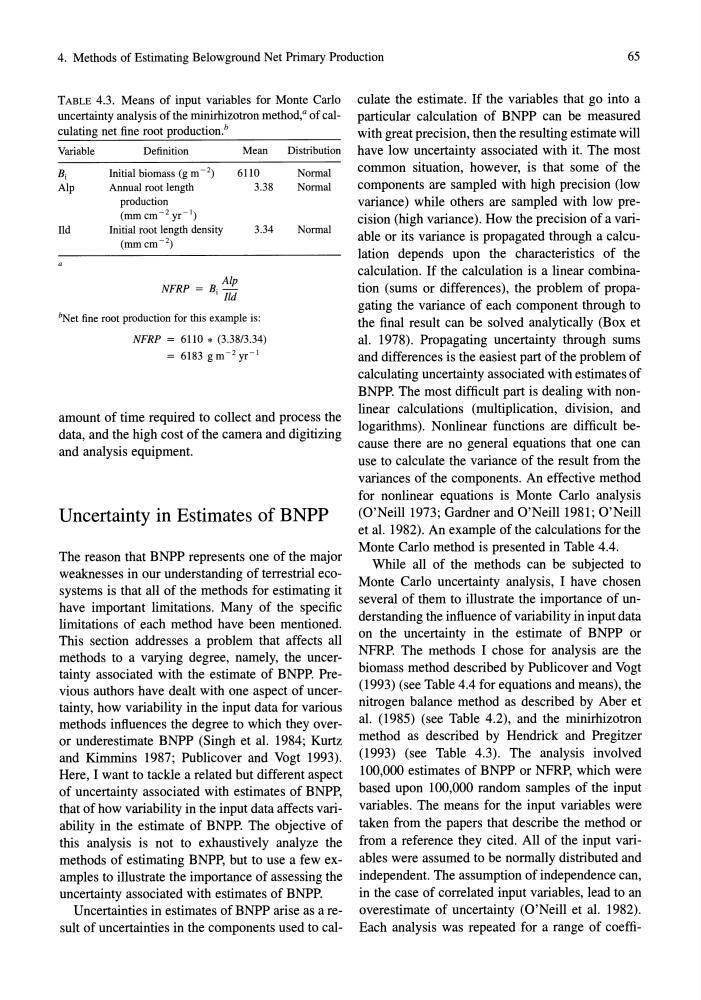
TABLE 4.3. Means of input variables for Monte Carlo
uncertainty analysis of the minirhizotron method, a of calculating net fine root production.h
Variable
Bj
Alp
TId
Definition
Mean
Initial biomass (g m - 2)
6110
Annual root length
production
(mm cm- 2 yr- 1 )
Initial root length density
(mmcm- 2 )
Alp
NFRP = B·I Ild
3.38
3.34
~et fine root production for this example is:
NFRP = 6110 * (3.38/3.34)
= 6183 gm- 2 yr- 1
Distribution
Normal
Normal
Normal
amount of time required to collect and process the
data, and the high cost of the camera and digitizing
and analysis equipment.
Uncertainty in Estimates of BNPP
The reason that BNPP represents one of the major
weaknesses in our understanding of terrestrial ecosystems is that all of the methods for estimating it
have important limitations. Many of the specific
limitations of each method have been mentioned.
This section addresses a problem that affects all
methods to a varying degree, namely, the uncertainty associated with the estimate of BNPP. Previous authors have dealt with one aspect of uncertainty, how variability in the input data for various
methods influences the degree to which they overor underestimate BNPP (Singh et al. 1984; Kurtz
and Kimmins 1987; Publicover and Vogt 1993).
Here, I want to tackle a related but different aspect
of uncertainty associated with estimates of BNPP,
that of how variability in the input data affects variability in the estimate of BNPP. The objective of
this analysis is not to exhaustively analyze the
methods of estimating BNPP, but to use a few examples to illustrate the importance of assessing the
uncertainty associated with estimates of BNPP.
Uncertainties in estimates of BNPP arise as a result of uncertainties in the components used to calculate the estimate. If the variables that go into a
particular calculation of BNPP can be measured
with great precision, then the resulting estimate will
have low uncertainty associated with it. The most
common situation, however, is that some of the
components are sampled with high precision (low
variance) while others are sampled with low precision (high variance). How the precision of a variable or its variance is propagated through a calculation depends upon the characteristics of the
calculation. If the calculation is a linear combination (sums or differences), the problem of propagating the variance of each component through to
the final result can be solved analytically (Box et
al. 1978). Propagating uncertainty through sums
and differences is the easiest part of the problem of
calculating uncertainty associated with estimates of
BNPP. The most difficult part is dealing with nonlinear calculations (multiplication, division, and
logarithms). Nonlinear functions are difficult because there are no general equations that one can
use to calculate the variance of the result from the
variances of the components. An effective method
for nonlinear equations is Monte Carlo analysis
(O'Neill 1973; Gardner and O'Neill 1981; O'Neill
et al. 1982). An example of the calculations for the
Monte Carlo method is presented in Table 4.4.
While all of the methods can be subjected to
Monte Carlo uncertainty analysis, I have chosen
several of them to illustrate the importance of understanding the influence of variability in input data
on the uncertainty in the estimate of BNPP or
NFRP. The methods I chose for analysis are the
biomass method described by Publicover and Vogt
(1993) (see Table 4.4 for equations and means), the
nitrogen balance method as described by Aber et
al. (1985) (see Table 4.2), and the minirhizotron
method as described by Hendrick and Pregitzer
(1993) (see Table 4.3). The analysis involved
100,000 estimates of BNPP or NFRP, which were
based upon 100,000 random samples of the input
variables. The means for the input variables were
taken from the papers that describe the method or
from a reference they cited. All of the input variables were assumed to be normally distributed and
independent. The assumption of independence can,
in the case of correlated input variables, lead to an
overestimate of uncertainty (O'Neill et al. 1982).
Each analysis was repeated for a range of coeffi-
65
TABLE 4.3. Means of input variables for Monte Carlo
uncertainty analysis of the minirhizotron method, a of calculating net fine root production.h
Variable
Bj
Alp
TId
Definition
Mean
Initial biomass (g m - 2)
6110
Annual root length
production
(mm cm- 2 yr- 1 )
Initial root length density
(mmcm- 2 )
Alp
NFRP = B·I Ild
3.38
3.34
~et fine root production for this example is:
NFRP = 6110 * (3.38/3.34)
= 6183 gm- 2 yr- 1
Distribution
Normal
Normal
Normal
amount of time required to collect and process the
data, and the high cost of the camera and digitizing
and analysis equipment.
Uncertainty in Estimates of BNPP
The reason that BNPP represents one of the major
weaknesses in our understanding of terrestrial ecosystems is that all of the methods for estimating it
have important limitations. Many of the specific
limitations of each method have been mentioned.
This section addresses a problem that affects all
methods to a varying degree, namely, the uncertainty associated with the estimate of BNPP. Previous authors have dealt with one aspect of uncertainty, how variability in the input data for various
methods influences the degree to which they overor underestimate BNPP (Singh et al. 1984; Kurtz
and Kimmins 1987; Publicover and Vogt 1993).
Here, I want to tackle a related but different aspect
of uncertainty associated with estimates of BNPP,
that of how variability in the input data affects variability in the estimate of BNPP. The objective of
this analysis is not to exhaustively analyze the
methods of estimating BNPP, but to use a few examples to illustrate the importance of assessing the
uncertainty associated with estimates of BNPP.
Uncertainties in estimates of BNPP arise as a result of uncertainties in the components used to calculate the estimate. If the variables that go into a
particular calculation of BNPP can be measured
with great precision, then the resulting estimate will
have low uncertainty associated with it. The most
common situation, however, is that some of the
components are sampled with high precision (low
variance) while others are sampled with low precision (high variance). How the precision of a variable or its variance is propagated through a calculation depends upon the characteristics of the
calculation. If the calculation is a linear combination (sums or differences), the problem of propagating the variance of each component through to
the final result can be solved analytically (Box et
al. 1978). Propagating uncertainty through sums
and differences is the easiest part of the problem of
calculating uncertainty associated with estimates of
BNPP. The most difficult part is dealing with nonlinear calculations (multiplication, division, and
logarithms). Nonlinear functions are difficult because there are no general equations that one can
use to calculate the variance of the result from the
variances of the components. An effective method
for nonlinear equations is Monte Carlo analysis
(O'Neill 1973; Gardner and O'Neill 1981; O'Neill
et al. 1982). An example of the calculations for the
Monte Carlo method is presented in Table 4.4.
While all of the methods can be subjected to
Monte Carlo uncertainty analysis, I have chosen
several of them to illustrate the importance of understanding the influence of variability in input data
on the uncertainty in the estimate of BNPP or
NFRP. The methods I chose for analysis are the
biomass method described by Publicover and Vogt
(1993) (see Table 4.4 for equations and means), the
nitrogen balance method as described by Aber et
al. (1985) (see Table 4.2), and the minirhizotron
method as described by Hendrick and Pregitzer
(1993) (see Table 4.3). The analysis involved
100,000 estimates of BNPP or NFRP, which were
based upon 100,000 random samples of the input
variables. The means for the input variables were
taken from the papers that describe the method or
from a reference they cited. All of the input variables were assumed to be normally distributed and
independent. The assumption of independence can,
in the case of correlated input variables, lead to an
overestimate of uncertainty (O'Neill et al. 1982).
Each analysis was repeated for a range of coeffi-